Role
Strategic Analyst
Industry
Finance / Retail Banking
Duration
2 Weeks
View Live Dashboard
View Live Dashboard
Project Overview
This report provides a data-driven diagnosis of the root causes of customer complaints, service delivery failures, and financial risk exposure at the bank. The goal is to shift the organization from a reactive complaint handler to a proactive service leader, focusing on customer retention, operational efficiency, and fraud mitigation.
Process & Methodology
Data Ingestion, Transformation & Modeling: This phase established the foundation for reliable analysis. Tools: CSV Files, Power Query, Power BI Modeling (Star schema)
Advanced Metric Calculation: This phase created the necessary business logic to quantify performance gaps. Tool: DAX (Data Analysis Expressions)
Strategic Analysis & Visualization: This final phase translated the metrics into actionable insights for executives. Tool: Power BI
Business Questions
What is the most common type of complaint and how has its volume changed over time?
Which customer segments generate the most complaints, indicating the highest churn risk?
Which complaint types take the longest to resolve, indicating a potential process gap?
What is the actual backlog volume, and how does actual resolution time compare to the SLA.
What is the exposure and what is the status of High-Risk fraud cases?
How wide is the SLA gap for Fraud complaints specifically?
Key Findings & Insights
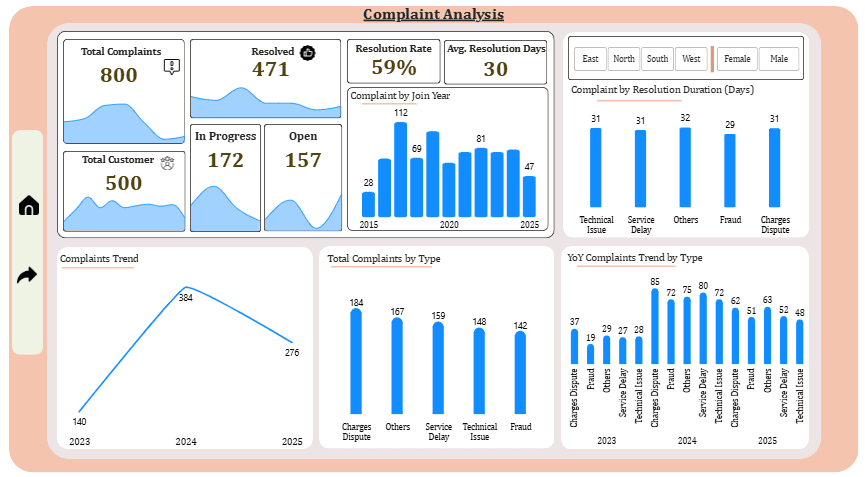
Substantial Backlog: The bank processed 800 Total Complaints but has a substantial backlog of 329 cases (41.1% of total), split between 157 Open and 172 In Progress.
"Others" (31.56 Days) and "Technical Issues" (31.31 Days) take the longest to resolve, suggesting these categories are prime process bottlenecks. Service Delay is resolved the quickest (27.80 Days) but has the lowest resolution rate (56.0%), indicating agents prioritize speed over quality, risking customer churn.
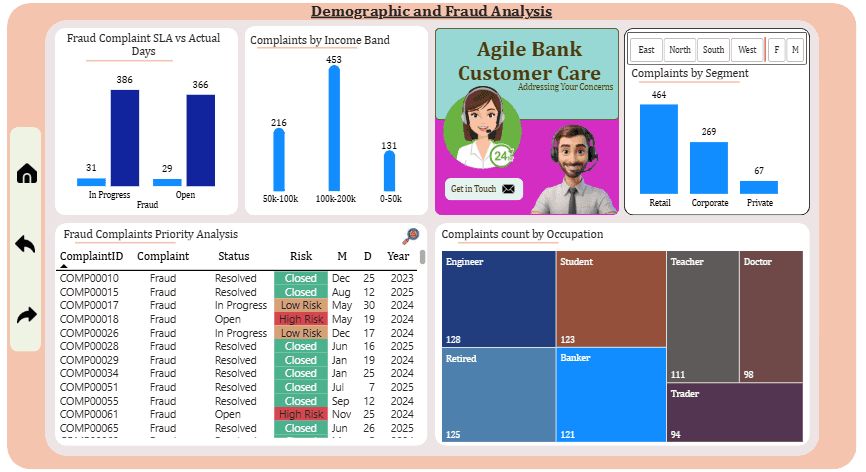
(The 47% Gap) Critical SLA Failure: The actual time to resolve 'In Progress' and 'Open' Fraud complaints is 386 Days and 366 Days, failing the respective SLA targets of 31 Days and 29 Days. This represents over 80% SLA gap in handling the backlog.
The Retail Segment generates the vast majority of complaints (464), necessitating a focus on mass-market service interactions.
Churn Risk & Demographic Correlation Highest Churn Risk Segment: The $100k−$200k Income Band generates the most complaints by far (453 complaints), marking this high-value group as the highest potential churn risk.
The cohorts who joined in 2017 (112 complaints), 2020 (101 complaints), and 2023 (108 complaints) are the most problematic groups, indicating historical weaknesses in onboarding or product experience.
Charges Dispute is the most common overall (184 cases) and combines with its 30.86 Day resolution speed to significantly drag down the bank's 30.06 Day average.
Critical Risk & Fraud Exposure Urgency Failure: The system is failing to triage risk; High-Risk Fraud cases are included in the 388 Day queue. The sample includes High-Risk Fraud cases that are still Open or In Progress (e.g., COMP00061), representing an ongoing financial and reputational risk.
Fraud has the highest resolution rate (62.0%), but its focus must immediately shift to urgency for high-risk cases rather than just overall success rate.
Recommendations
Implement a Risk-Based Urgency Flagging System: Change the priority rule for fraud. Any Open or In Progress High-Risk Fraud case must be automatically escalated to a 1-3 Day. Immediately allocate a task force to address the 388 Day Actual Fraud resolution time.
Target Technical Issues and Others as the slowest categories for process optimization.
High-Value Customer Retention: Launch a focused initiative to proactively contact customers in the $100k−$200k Income Band. They have the highest churn risk.
Conduct a deep-dive audit on the Charges Dispute process (184 cases) to fix systemic issues in billing or transaction communication.
Cohort Engagement Campaign: Launch a targeted campaign focusing on the 2017 and 2020 cohorts to mitigate long-term dissatisfaction and stabilize service demand.
Expected Impacts
Category Impact Statement Target Metric Operational Efficiency Faster service delivery and improved resource allocation, effectively shrinking the backlog.
Reduce 'In Progress' resolution time from 46.28 Days to below 35 Days within 3 months.
Risk Mitigation Minimized financial losses and improved regulatory compliance by quickly closing high-risk cases.
Reduce the number of unresolved High-Risk Fraud cases to zero by the end of the next reporting cycle.
Customer Experience Reduction in customer frustration and noticeable improvement in retention among high-value customers.
Reduce the $100k−$200k Income Band complaint volume by 15% within 6 months.
Metro Bank Analytics
Metro Bank Analytics
Metro Bank Analytics
A Customer Experience and Risk Audit
A Customer Experience and Risk Audit
Role
Strategic Analyst
Industry
Finance / Retail Banking
Duration
2 Weeks

View Live Dashboard
Project Overview
This report provides a data-driven diagnosis of the root causes of customer complaints, service delivery failures, and financial risk exposure at the bank. The goal is to shift the organization from a reactive complaint handler to a proactive service leader, focusing on customer retention, operational efficiency, and fraud mitigation.
Process & Methodology
Data Ingestion, Transformation & Modeling: This phase established the foundation for reliable analysis. Tools: CSV Files, Power Query, Power BI Modeling (Star schema)
Advanced Metric Calculation: This phase created the necessary business logic to quantify performance gaps. Tool: DAX (Data Analysis Expressions)
Strategic Analysis & Visualization: This final phase translated the metrics into actionable insights for executives. Tool: Power BI
Business Questions
What is the most common type of complaint and how has its volume changed over time?
Which customer segments generate the most complaints, indicating the highest churn risk?
Which complaint types take the longest to resolve, indicating a potential process gap?
What is the actual backlog volume, and how does actual resolution time compare to the SLA.
What is the exposure and what is the status of High-Risk fraud cases?
How wide is the SLA gap for Fraud complaints specifically?
Key Findings & Insights
Substantial Backlog: The bank processed 800 Total Complaints but has a substantial backlog of 329 cases (41.1% of total), split between 157 Open and 172 In Progress.
"Others" (31.56 Days) and "Technical Issues" (31.31 Days) take the longest to resolve, suggesting these categories are prime process bottlenecks. Service Delay is resolved the quickest (27.80 Days) but has the lowest resolution rate (56.0%), indicating agents prioritize speed over quality, risking customer churn.
(The 47% Gap) Critical SLA Failure: The actual time to resolve 'In Progress' and 'Open' Fraud complaints is 386 Days and 366 Days, failing the respective SLA targets of 31 Days and 29 Days. This represents over 80% SLA gap in handling the backlog.
The Retail Segment generates the vast majority of complaints (464), necessitating a focus on mass-market service interactions.
Churn Risk & Demographic Correlation Highest Churn Risk Segment: The $100k−$200k Income Band generates the most complaints by far (453 complaints), marking this high-value group as the highest potential churn risk.
The cohorts who joined in 2017 (112 complaints), 2020 (101 complaints), and 2023 (108 complaints) are the most problematic groups, indicating historical weaknesses in onboarding or product experience.
Charges Dispute is the most common overall (184 cases) and combines with its 30.86 Day resolution speed to significantly drag down the bank's 30.06 Day average.
Critical Risk & Fraud Exposure Urgency Failure: The system is failing to triage risk; High-Risk Fraud cases are included in the 388 Day queue. The sample includes High-Risk Fraud cases that are still Open or In Progress (e.g., COMP00061), representing an ongoing financial and reputational risk.
Fraud has the highest resolution rate (62.0%), but its focus must immediately shift to urgency for high-risk cases rather than just overall success rate.
Recommendations
Implement a Risk-Based Urgency Flagging System: Change the priority rule for fraud. Any Open or In Progress High-Risk Fraud case must be automatically escalated to a 1-3 Day. Immediately allocate a task force to address the 388 Day Actual Fraud resolution time.
Target Technical Issues and Others as the slowest categories for process optimization.
High-Value Customer Retention: Launch a focused initiative to proactively contact customers in the $100k−$200k Income Band. They have the highest churn risk.
Conduct a deep-dive audit on the Charges Dispute process (184 cases) to fix systemic issues in billing or transaction communication.
Cohort Engagement Campaign: Launch a targeted campaign focusing on the 2017 and 2020 cohorts to mitigate long-term dissatisfaction and stabilize service demand.
Expected Impacts
Category Impact Statement Target Metric Operational Efficiency Faster service delivery and improved resource allocation, effectively shrinking the backlog.
Reduce 'In Progress' resolution time from 46.28 Days to below 35 Days within 3 months.
Risk Mitigation Minimized financial losses and improved regulatory compliance by quickly closing high-risk cases.
Reduce the number of unresolved High-Risk Fraud cases to zero by the end of the next reporting cycle.
Customer Experience Reduction in customer frustration and noticeable improvement in retention among high-value customers.
Reduce the $100k−$200k Income Band complaint volume by 15% within 6 months.
View Document

Electricity Consumption & Loss Analysis
Electricity Consumption & Loss Analysis
Assessing regional, income-based, and efficiency disparities
Assessing regional, income-based, and efficiency disparities

Facility Operations Service Request & Maintenance Performance Dashboard
Facility Operations Service Request & Maintenance Performance Dashboard
Operational analytics system for tracking resident complaints, monitoring maintenance performance, and identifying recurring infrastructure issues across residential blocks.
Operational analytics system for tracking resident complaints, monitoring maintenance performance, and identifying recurring infrastructure issues across residential blocks.
Superstore Operational Efficiency & Sales Performance Analysis
Superstore Operational Efficiency & Sales Performance Analysis
A data-driven review of profitability and supply chain efficiency.
A data-driven review of profitability and supply chain efficiency.

Facility Operations & Maintenance Performance Analysis
Facility Operations & Maintenance Performance Analysis
A data-driven review of maintenance demand, service efficiency, and infrastructure performance.
A data-driven review of maintenance demand, service efficiency, and infrastructure performance.
Personal Finance Tracker
Personal Finance Tracker
Summary of Incomes, Savings and Expenses Insight
Summary of Incomes, Savings and Expenses Insight

J&SONS FARM Sales Analysis
J&SONS FARM Sales Analysis
Implementing data-driven improvements
Implementing data-driven improvements

Digital Marketing Campaign Analysis
Digital Marketing Campaign Analysis
Analyzing February 2025 Campaigns to Maximize Profitability and Conversion
Analyzing February 2025 Campaigns to Maximize Profitability and Conversion

U.S. Population Dashboard (1950–2015)
U.S. Population Dashboard (1950–2015)
Demographic Trends for Healthcare Planning
Demographic Trends for Healthcare Planning

London Short-Let Market Analysis
London Short-Let Market Analysis
Uncovering Pricing, Host Behavior, and Market Opportunities Across 68K Property Listings
Uncovering Pricing, Host Behavior, and Market Opportunities Across 68K Property Listings

Telecom Customer Churn Analysis
Telecom Customer Churn Analysis
Identifying Churn Drivers and Revenue Risks to Improve Retention Strategy
Identifying Churn Drivers and Revenue Risks to Improve Retention Strategy

Product Sales Performance Dashboard
Product Sales Performance Dashboard
Identifying Revenue Drivers, Low-Margin Products, and Seasonal Trends Across SKUs
Identifying Revenue Drivers, Low-Margin Products, and Seasonal Trends Across SKUs

Customer Order Performance
Customer Order Performance
Optimizing Conversion, Segment Strategy, and Seasonal Sales Across Markets
Optimizing Conversion, Segment Strategy, and Seasonal Sales Across Markets