Role
Business Intelligence Analyst
Industry
Retail & Consumer Goods
Duration
2 Weeks
View Live Dashboard
View Live Dashboard
Stage 1: Process & Methodology
Cleaned sales data and created new columns in Excel
Transformed and reshaped data using Power Query
Built Power BI dashboard with DAX measures for profit, YoY, and margin
Analyzed seasonal spikes and bulk-buying behavior
Used KPI modeling and dashboard storytelling to highlight product performance
Stage 2: Business Questions
Which products drive revenue and profit?
What are the seasonal trends in sales?
Which items have low margins despite high volume?
Stage 3: Objectives
Identify top-performing products, analyze seasonal demand, and optimize pricing and inventory strategy.
Stage 4: Key Insights
Chocolate Chip cookies generated over $1M in profit
Sugar Cookie sold 170K units but had minimal profit
Snickerdoodle and Fortune Cookie underperformed
October and December showed holiday-driven demand
High average units per transaction (~1,600) suggest B2B buying behavior
Stage 5: Recommendations
Adjust pricing or reduce costs for low-margin items
Promote top performers through campaigns
Rebrand or phase out underperformers
Prepare early for Q4 demand
Introduce B2B pricing tiers and profitability index

Product Sales Performance Dashboard
Product Sales Performance Dashboard
Product Sales Performance Dashboard
Identifying Revenue Drivers, Low-Margin Products, and Seasonal Trends Across SKUs
Identifying Revenue Drivers, Low-Margin Products, and Seasonal Trends Across SKUs
Role
Business Intelligence Analyst
Industry
Retail & Consumer Goods
Duration
2 Weeks
View Live Dashboard
Stage 1: Process & Methodology
Cleaned sales data and created new columns in Excel
Transformed and reshaped data using Power Query
Built Power BI dashboard with DAX measures for profit, YoY, and margin
Analyzed seasonal spikes and bulk-buying behavior
Used KPI modeling and dashboard storytelling to highlight product performance
Stage 2: Business Questions
Which products drive revenue and profit?
What are the seasonal trends in sales?
Which items have low margins despite high volume?
Stage 3: Objectives
Identify top-performing products, analyze seasonal demand, and optimize pricing and inventory strategy.
Stage 4: Key Insights
Chocolate Chip cookies generated over $1M in profit
Sugar Cookie sold 170K units but had minimal profit
Snickerdoodle and Fortune Cookie underperformed
October and December showed holiday-driven demand
High average units per transaction (~1,600) suggest B2B buying behavior
Stage 5: Recommendations
Adjust pricing or reduce costs for low-margin items
Promote top performers through campaigns
Rebrand or phase out underperformers
Prepare early for Q4 demand
Introduce B2B pricing tiers and profitability index
View Document

Electricity Consumption & Loss Analysis
Electricity Consumption & Loss Analysis
Assessing regional, income-based, and efficiency disparities
Assessing regional, income-based, and efficiency disparities

Facility Operations Service Request & Maintenance Performance Dashboard
Facility Operations Service Request & Maintenance Performance Dashboard
Operational analytics system for tracking resident complaints, monitoring maintenance performance, and identifying recurring infrastructure issues across residential blocks.
Operational analytics system for tracking resident complaints, monitoring maintenance performance, and identifying recurring infrastructure issues across residential blocks.
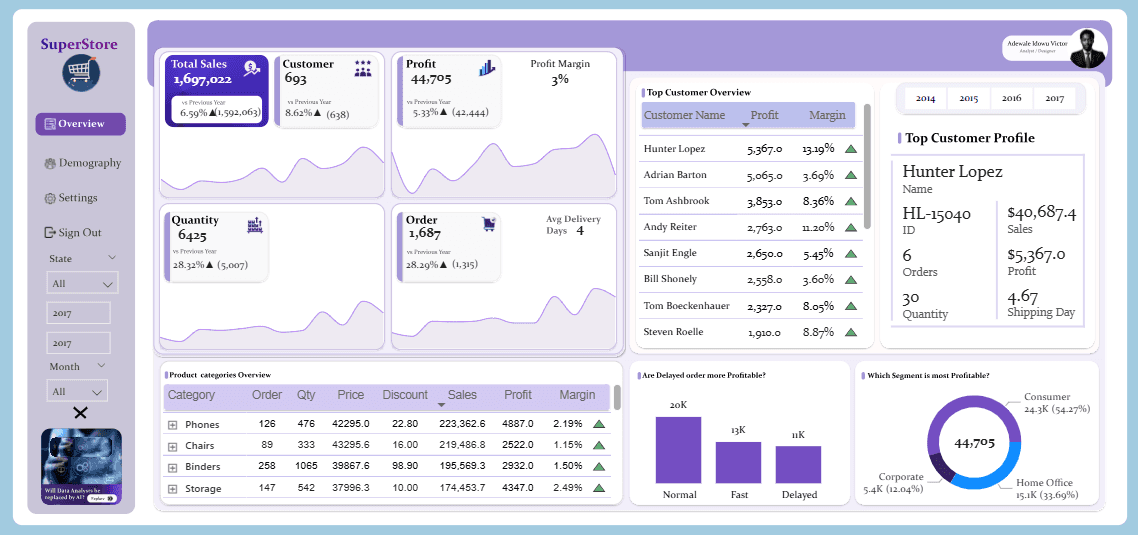
Superstore Operational Efficiency & Sales Performance Analysis
Superstore Operational Efficiency & Sales Performance Analysis
A data-driven review of profitability and supply chain efficiency.
A data-driven review of profitability and supply chain efficiency.

Facility Operations & Maintenance Performance Analysis
Facility Operations & Maintenance Performance Analysis
A data-driven review of maintenance demand, service efficiency, and infrastructure performance.
A data-driven review of maintenance demand, service efficiency, and infrastructure performance.

Metro Bank Analytics
Metro Bank Analytics
A Customer Experience and Risk Audit
A Customer Experience and Risk Audit
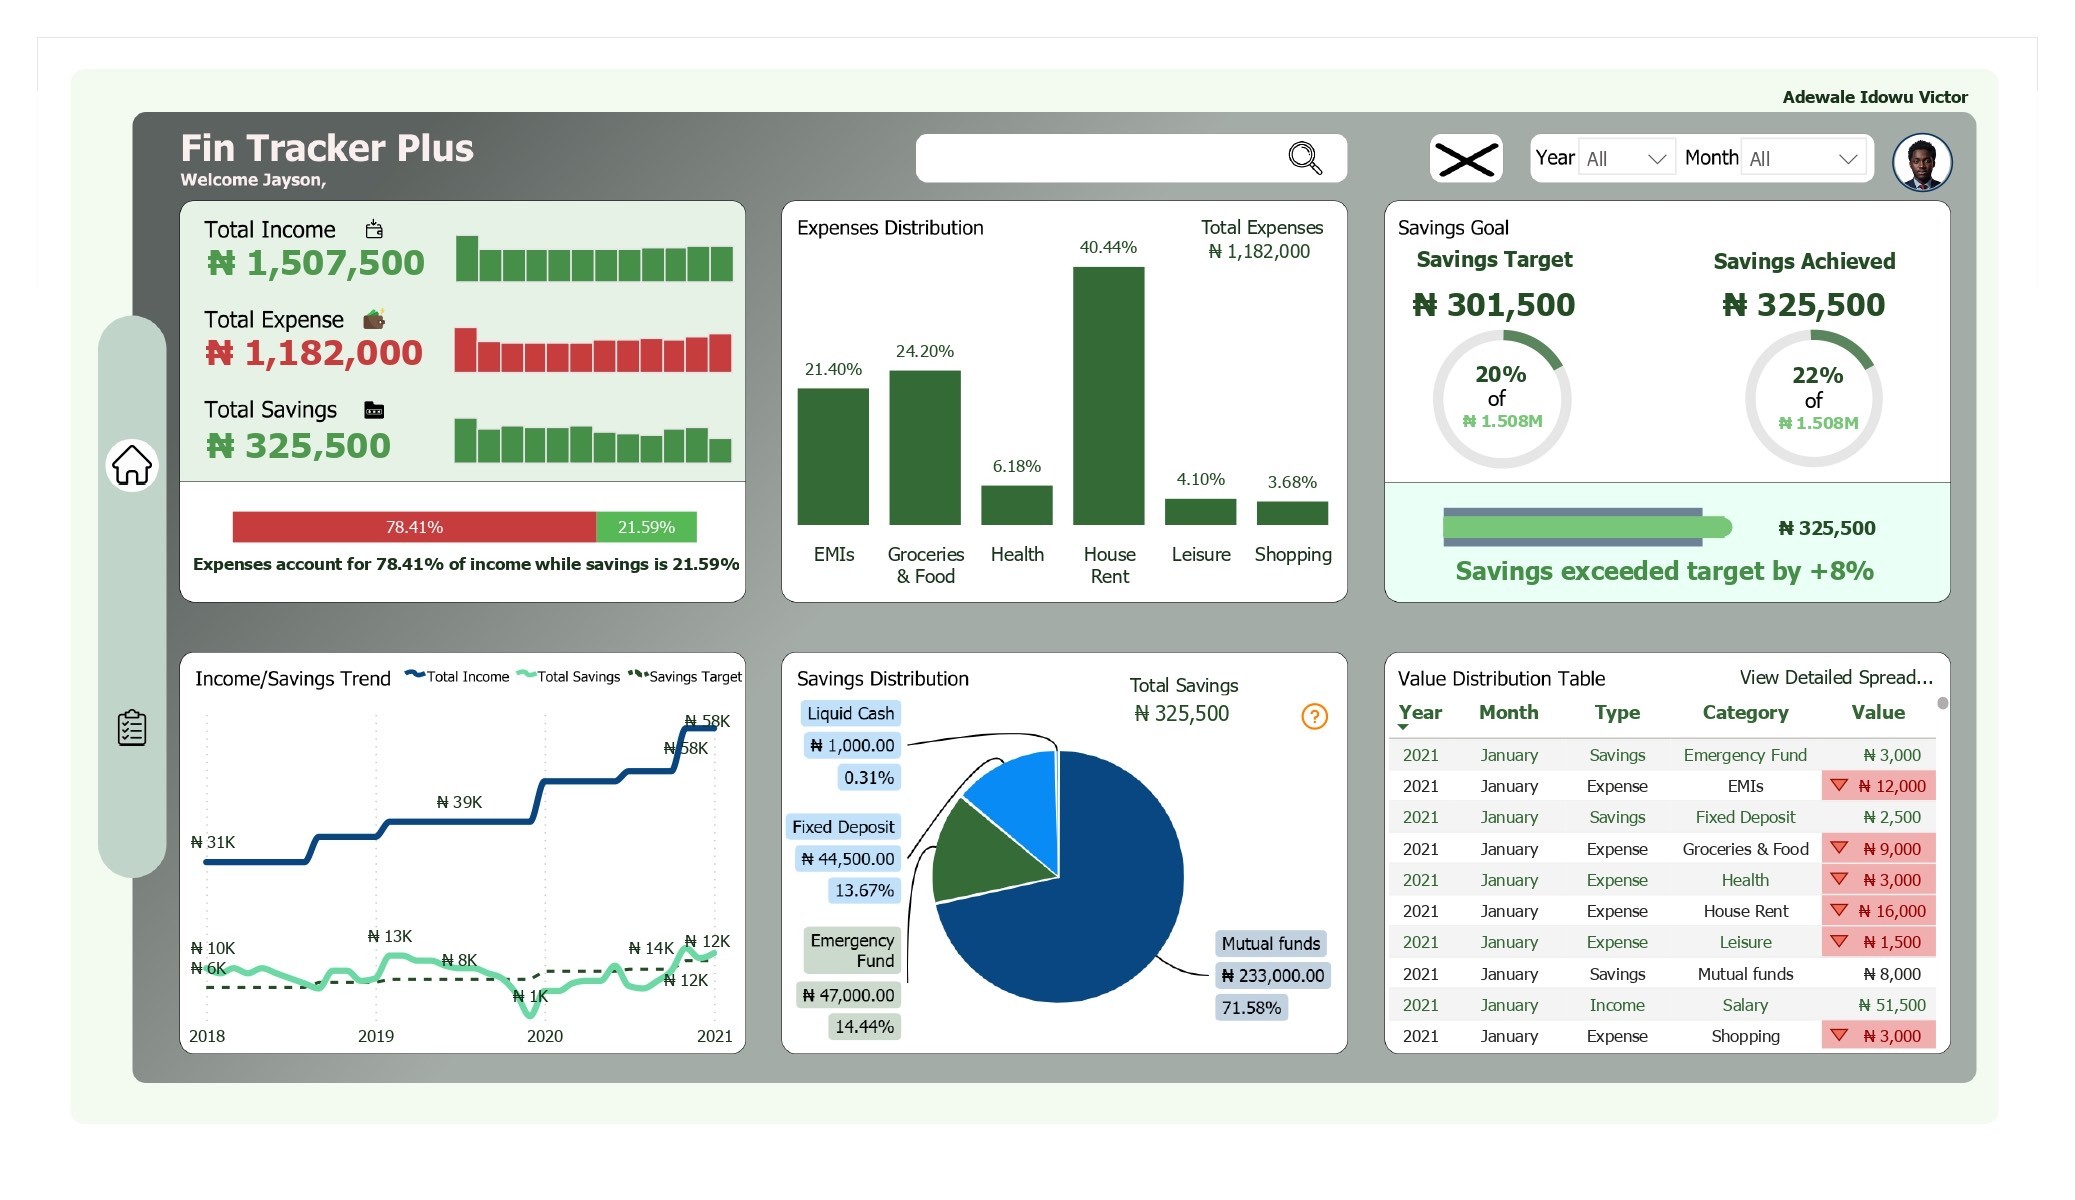
Personal Finance Tracker
Personal Finance Tracker
Summary of Incomes, Savings and Expenses Insight
Summary of Incomes, Savings and Expenses Insight

J&SONS FARM Sales Analysis
J&SONS FARM Sales Analysis
Implementing data-driven improvements
Implementing data-driven improvements

Digital Marketing Campaign Analysis
Digital Marketing Campaign Analysis
Analyzing February 2025 Campaigns to Maximize Profitability and Conversion
Analyzing February 2025 Campaigns to Maximize Profitability and Conversion

U.S. Population Dashboard (1950–2015)
U.S. Population Dashboard (1950–2015)
Demographic Trends for Healthcare Planning
Demographic Trends for Healthcare Planning

London Short-Let Market Analysis
London Short-Let Market Analysis
Uncovering Pricing, Host Behavior, and Market Opportunities Across 68K Property Listings
Uncovering Pricing, Host Behavior, and Market Opportunities Across 68K Property Listings

Telecom Customer Churn Analysis
Telecom Customer Churn Analysis
Identifying Churn Drivers and Revenue Risks to Improve Retention Strategy
Identifying Churn Drivers and Revenue Risks to Improve Retention Strategy

Customer Order Performance
Customer Order Performance
Optimizing Conversion, Segment Strategy, and Seasonal Sales Across Markets
Optimizing Conversion, Segment Strategy, and Seasonal Sales Across Markets