Role
Data Analyst
Industry
E-commerce & Digital Services
Duration
1.5 Week
View Live Dashboard
Stage 1: Process & Methodology
Ingested and cleaned transactional data using Excel and Power Query
Segmented customers by age and order frequency
Built KPIs using DAX to analyze order value and completion rates
Mapped geographic performance and seasonal trends
Designed interactive dashboards using segmentation modeling and behavioral analysis
Stage 2: Business Questions
What is the order completion rate and lost value?
Which age groups and devices dominate order behavior?
Which cities and products perform best?
Stage 3: Objectives
Analyze customer behavior, order performance, and seasonal trends to improve conversion and retention.
Stage 4: Key Insights
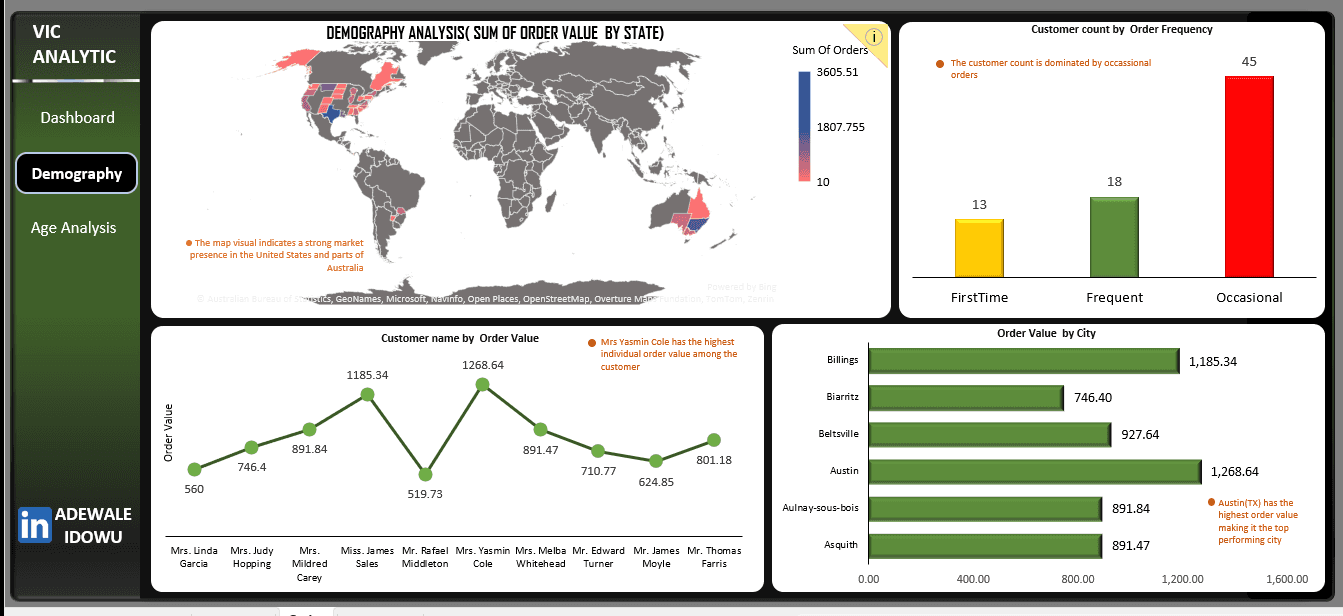
84.85% order completion rate; elderly customers had highest order value
Adults dominated order count, mostly via mobile
Austin (TX) was top-performing city
Digital Services was the highest-value category
December was peak month; Jan, Feb, Aug were lowest
Stage 5: Recommendations
Optimize payment gateways for preferred cards
Recover lost value from abandoned/cancelled orders
Prioritize mobile-first campaigns for adults
Develop premium offers for elderly customers
Expand into high-performing markets
Launch loyalty programs and CRM systems
Customer Order Performance
Customer Order Performance
Customer Order Performance
Optimizing Conversion, Segment Strategy, and Seasonal Sales Across Markets
Optimizing Conversion, Segment Strategy, and Seasonal Sales Across Markets
Role
Data Analyst
Industry
E-commerce & Digital Services
Duration
1.5 Week

Stage 1: Process & Methodology
Ingested and cleaned transactional data using Excel and Power Query
Segmented customers by age and order frequency
Built KPIs using DAX to analyze order value and completion rates
Mapped geographic performance and seasonal trends
Designed interactive dashboards using segmentation modeling and behavioral analysis
Stage 2: Business Questions
What is the order completion rate and lost value?
Which age groups and devices dominate order behavior?
Which cities and products perform best?
Stage 3: Objectives
Analyze customer behavior, order performance, and seasonal trends to improve conversion and retention.
Stage 4: Key Insights
84.85% order completion rate; elderly customers had highest order value
Adults dominated order count, mostly via mobile
Austin (TX) was top-performing city
Digital Services was the highest-value category
December was peak month; Jan, Feb, Aug were lowest
Stage 5: Recommendations
Optimize payment gateways for preferred cards
Recover lost value from abandoned/cancelled orders
Prioritize mobile-first campaigns for adults
Develop premium offers for elderly customers
Expand into high-performing markets
Launch loyalty programs and CRM systems
View Document

Electricity Consumption & Loss Analysis
Electricity Consumption & Loss Analysis
Assessing regional, income-based, and efficiency disparities
Assessing regional, income-based, and efficiency disparities

Facility Operations Service Request & Maintenance Performance Dashboard
Facility Operations Service Request & Maintenance Performance Dashboard
Operational analytics system for tracking resident complaints, monitoring maintenance performance, and identifying recurring infrastructure issues across residential blocks.
Operational analytics system for tracking resident complaints, monitoring maintenance performance, and identifying recurring infrastructure issues across residential blocks.
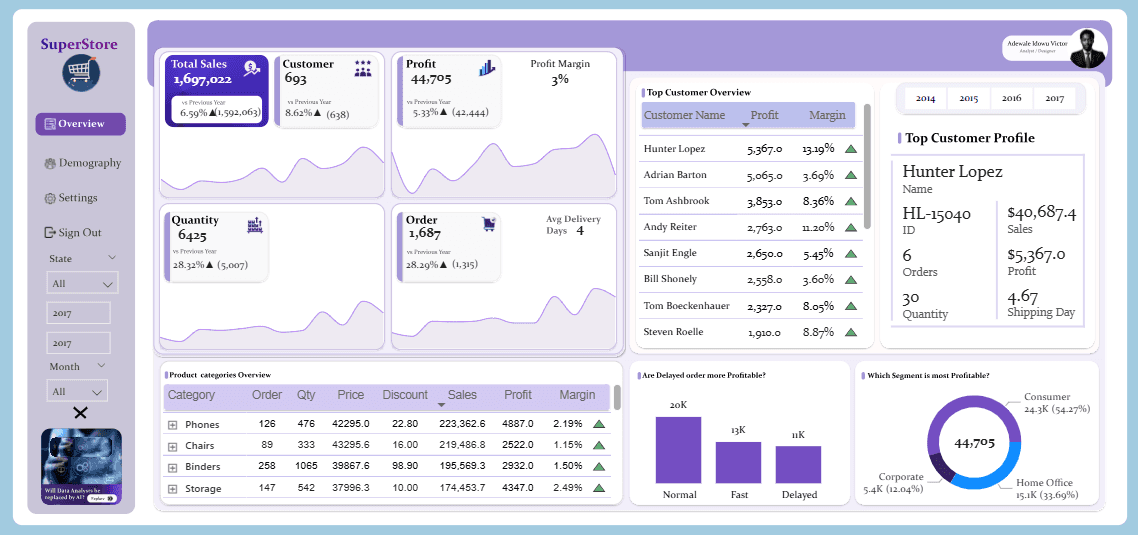
Superstore Operational Efficiency & Sales Performance Analysis
Superstore Operational Efficiency & Sales Performance Analysis
A data-driven review of profitability and supply chain efficiency.
A data-driven review of profitability and supply chain efficiency.

Facility Operations & Maintenance Performance Analysis
Facility Operations & Maintenance Performance Analysis
A data-driven review of maintenance demand, service efficiency, and infrastructure performance.
A data-driven review of maintenance demand, service efficiency, and infrastructure performance.

Metro Bank Analytics
Metro Bank Analytics
A Customer Experience and Risk Audit
A Customer Experience and Risk Audit
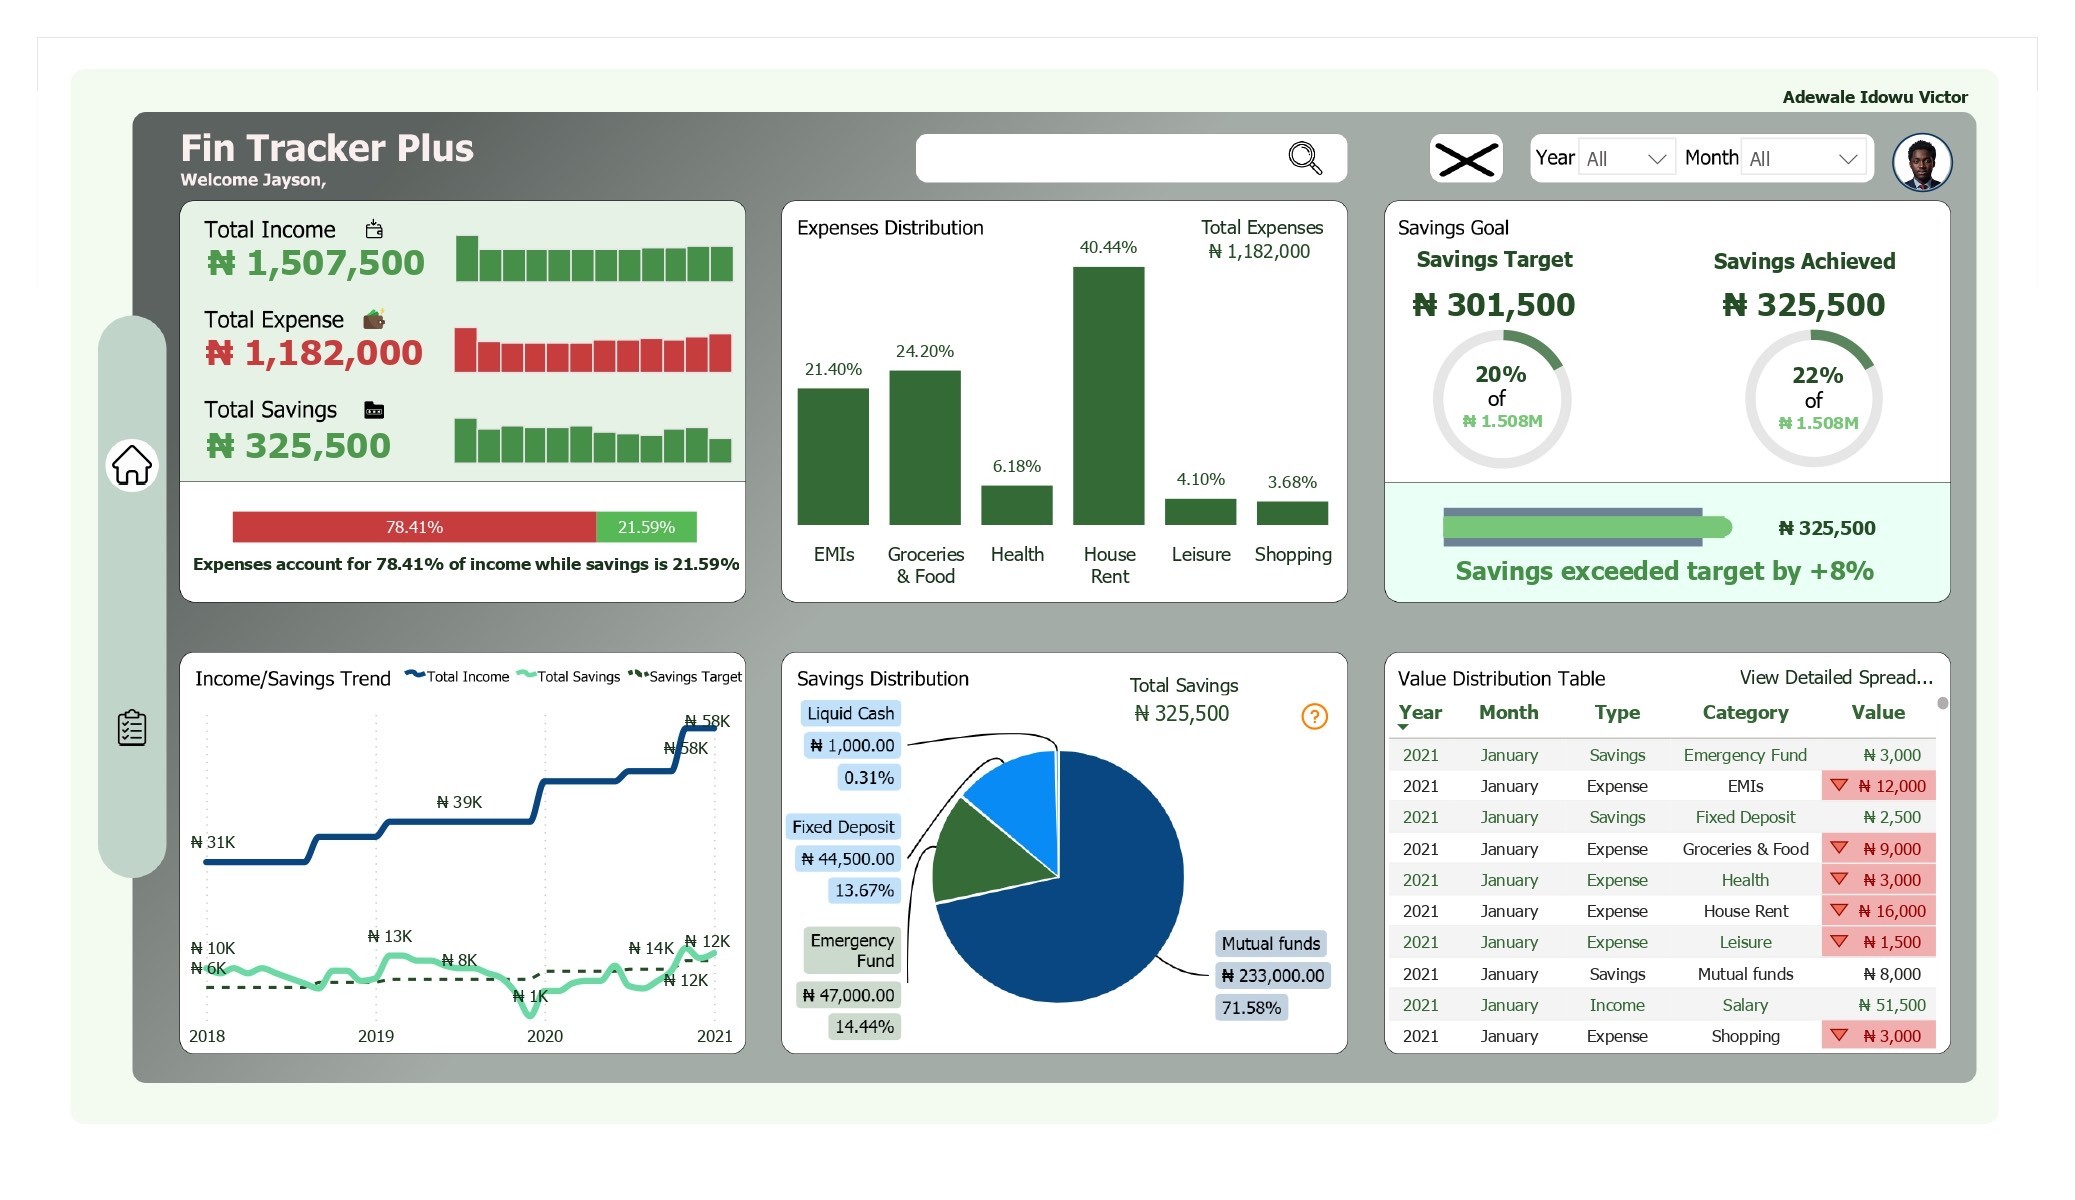
Personal Finance Tracker
Personal Finance Tracker
Summary of Incomes, Savings and Expenses Insight
Summary of Incomes, Savings and Expenses Insight

J&SONS FARM Sales Analysis
J&SONS FARM Sales Analysis
Implementing data-driven improvements
Implementing data-driven improvements

Digital Marketing Campaign Analysis
Digital Marketing Campaign Analysis
Analyzing February 2025 Campaigns to Maximize Profitability and Conversion
Analyzing February 2025 Campaigns to Maximize Profitability and Conversion

U.S. Population Dashboard (1950–2015)
U.S. Population Dashboard (1950–2015)
Demographic Trends for Healthcare Planning
Demographic Trends for Healthcare Planning

London Short-Let Market Analysis
London Short-Let Market Analysis
Uncovering Pricing, Host Behavior, and Market Opportunities Across 68K Property Listings
Uncovering Pricing, Host Behavior, and Market Opportunities Across 68K Property Listings

Telecom Customer Churn Analysis
Telecom Customer Churn Analysis
Identifying Churn Drivers and Revenue Risks to Improve Retention Strategy
Identifying Churn Drivers and Revenue Risks to Improve Retention Strategy

Product Sales Performance Dashboard
Product Sales Performance Dashboard
Identifying Revenue Drivers, Low-Margin Products, and Seasonal Trends Across SKUs
Identifying Revenue Drivers, Low-Margin Products, and Seasonal Trends Across SKUs