Role
Marketing Data Analyst
Industry
Digital Marketing & Advertising
Duration
2 Weeks
View Live Dashboard
View Live Dashboard
Project Overview
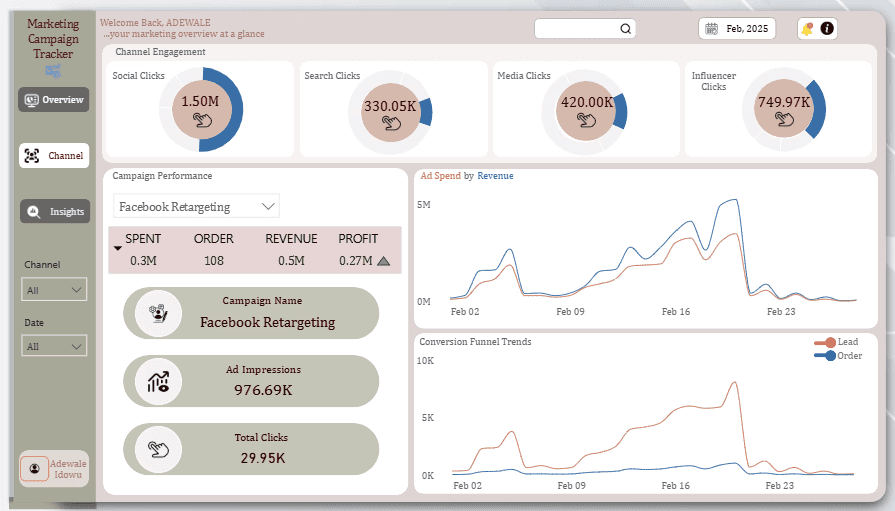
This campaign analysis evaluated digital marketing performance across multiple channels, identifying high-ROI campaigns and conversion bottlenecks. The dashboard enabled budget optimization and strategic decision-making.
Stage 1: Steps & Methodology
Extracted campaign data using SQL
Cleaned and modeled data in Power BI using Power Query and DAX
Built KPIs for revenue, profit, CAC, and conversion
Analyzed funnel drop-offs and channel efficiency
Delivered dashboards using ROI benchmarking and funnel analysis
Stage 2: Business Questions
Which channels and campaigns performed best?
What were the conversion rates and CAC across channels?
Where did funnel drop-offs occur?
Stage 3: Objectives
Evaluate campaign performance, identify high-ROI channels, and optimize funnel efficiency
Stage 4: Key Insights
$42.9M revenue and $12.3M profit in February
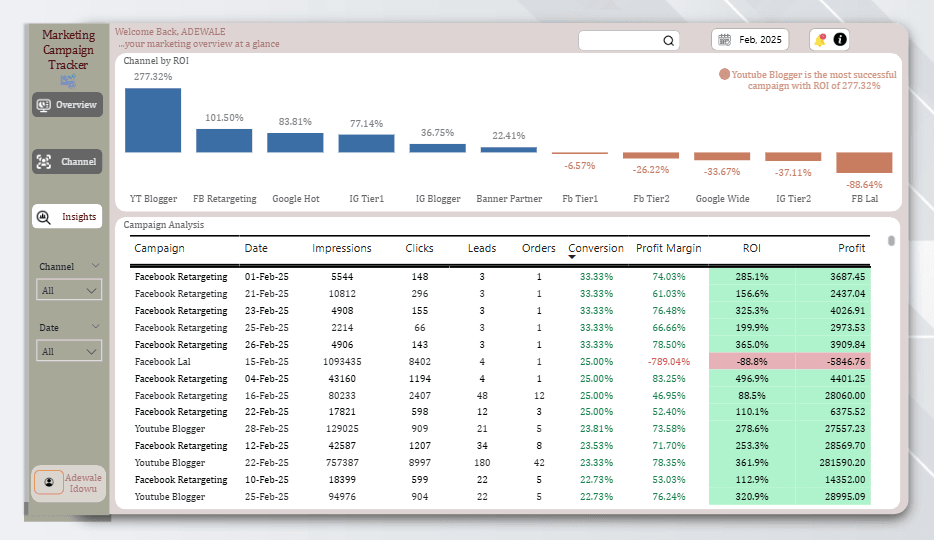
Influencer and YouTube Blogger campaigns had highest ROI
Social channel had high engagement but poor conversion
CAC ranged from $2.8K to $5.2K
Performance peaked around Feb 19–21
FB Tier2, IG Tier2, and FB Lal had negative ROI
Impression-to-click gaps revealed creative inefficiencies
Banner Partner and IG Blogger showed stable ROI
Stage 5: Recommendations
Scale high-performing campaigns
Pause or restructure low-ROI channels
Improve funnel design and ad creatives
Use CAC benchmarks for budget planning
Leverage social for top-funnel engagement
Replicate successful tactics from peak periods
Conduct root cause analysis for underperforming campaigns
Digital Marketing Campaign Analysis
Digital Marketing Campaign Analysis
Digital Marketing Campaign Analysis
Analyzing February 2025 Campaigns to Maximize Profitability and Conversion
Analyzing February 2025 Campaigns to Maximize Profitability and Conversion
Role
Marketing Data Analyst
Industry
Digital Marketing & Advertising
Duration
2 Weeks

View Live Dashboard
Project Overview
This campaign analysis evaluated digital marketing performance across multiple channels, identifying high-ROI campaigns and conversion bottlenecks. The dashboard enabled budget optimization and strategic decision-making.
Stage 1: Steps & Methodology
Extracted campaign data using SQL
Cleaned and modeled data in Power BI using Power Query and DAX
Built KPIs for revenue, profit, CAC, and conversion
Analyzed funnel drop-offs and channel efficiency
Delivered dashboards using ROI benchmarking and funnel analysis
Stage 2: Business Questions
Which channels and campaigns performed best?
What were the conversion rates and CAC across channels?
Where did funnel drop-offs occur?
Stage 3: Objectives
Evaluate campaign performance, identify high-ROI channels, and optimize funnel efficiency
Stage 4: Key Insights
$42.9M revenue and $12.3M profit in February
Influencer and YouTube Blogger campaigns had highest ROI
Social channel had high engagement but poor conversion
CAC ranged from $2.8K to $5.2K
Performance peaked around Feb 19–21
FB Tier2, IG Tier2, and FB Lal had negative ROI
Impression-to-click gaps revealed creative inefficiencies
Banner Partner and IG Blogger showed stable ROI
Stage 5: Recommendations
Scale high-performing campaigns
Pause or restructure low-ROI channels
Improve funnel design and ad creatives
Use CAC benchmarks for budget planning
Leverage social for top-funnel engagement
Replicate successful tactics from peak periods
Conduct root cause analysis for underperforming campaigns
View Document

Electricity Consumption & Loss Analysis
Electricity Consumption & Loss Analysis
Assessing regional, income-based, and efficiency disparities
Assessing regional, income-based, and efficiency disparities

Facility Operations Service Request & Maintenance Performance Dashboard
Facility Operations Service Request & Maintenance Performance Dashboard
Operational analytics system for tracking resident complaints, monitoring maintenance performance, and identifying recurring infrastructure issues across residential blocks.
Operational analytics system for tracking resident complaints, monitoring maintenance performance, and identifying recurring infrastructure issues across residential blocks.
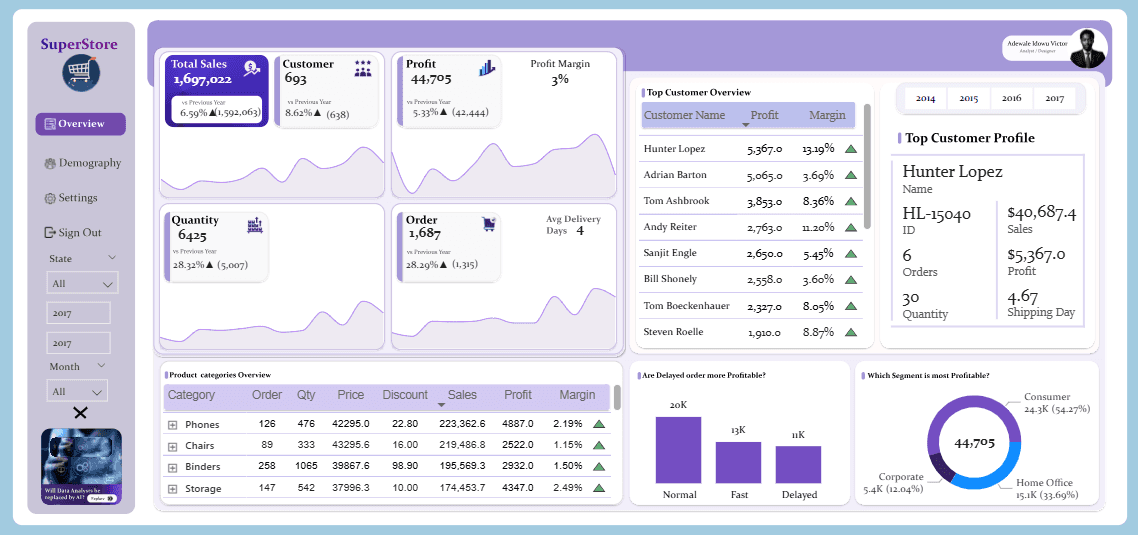
Superstore Operational Efficiency & Sales Performance Analysis
Superstore Operational Efficiency & Sales Performance Analysis
A data-driven review of profitability and supply chain efficiency.
A data-driven review of profitability and supply chain efficiency.

Facility Operations & Maintenance Performance Analysis
Facility Operations & Maintenance Performance Analysis
A data-driven review of maintenance demand, service efficiency, and infrastructure performance.
A data-driven review of maintenance demand, service efficiency, and infrastructure performance.

Metro Bank Analytics
Metro Bank Analytics
A Customer Experience and Risk Audit
A Customer Experience and Risk Audit
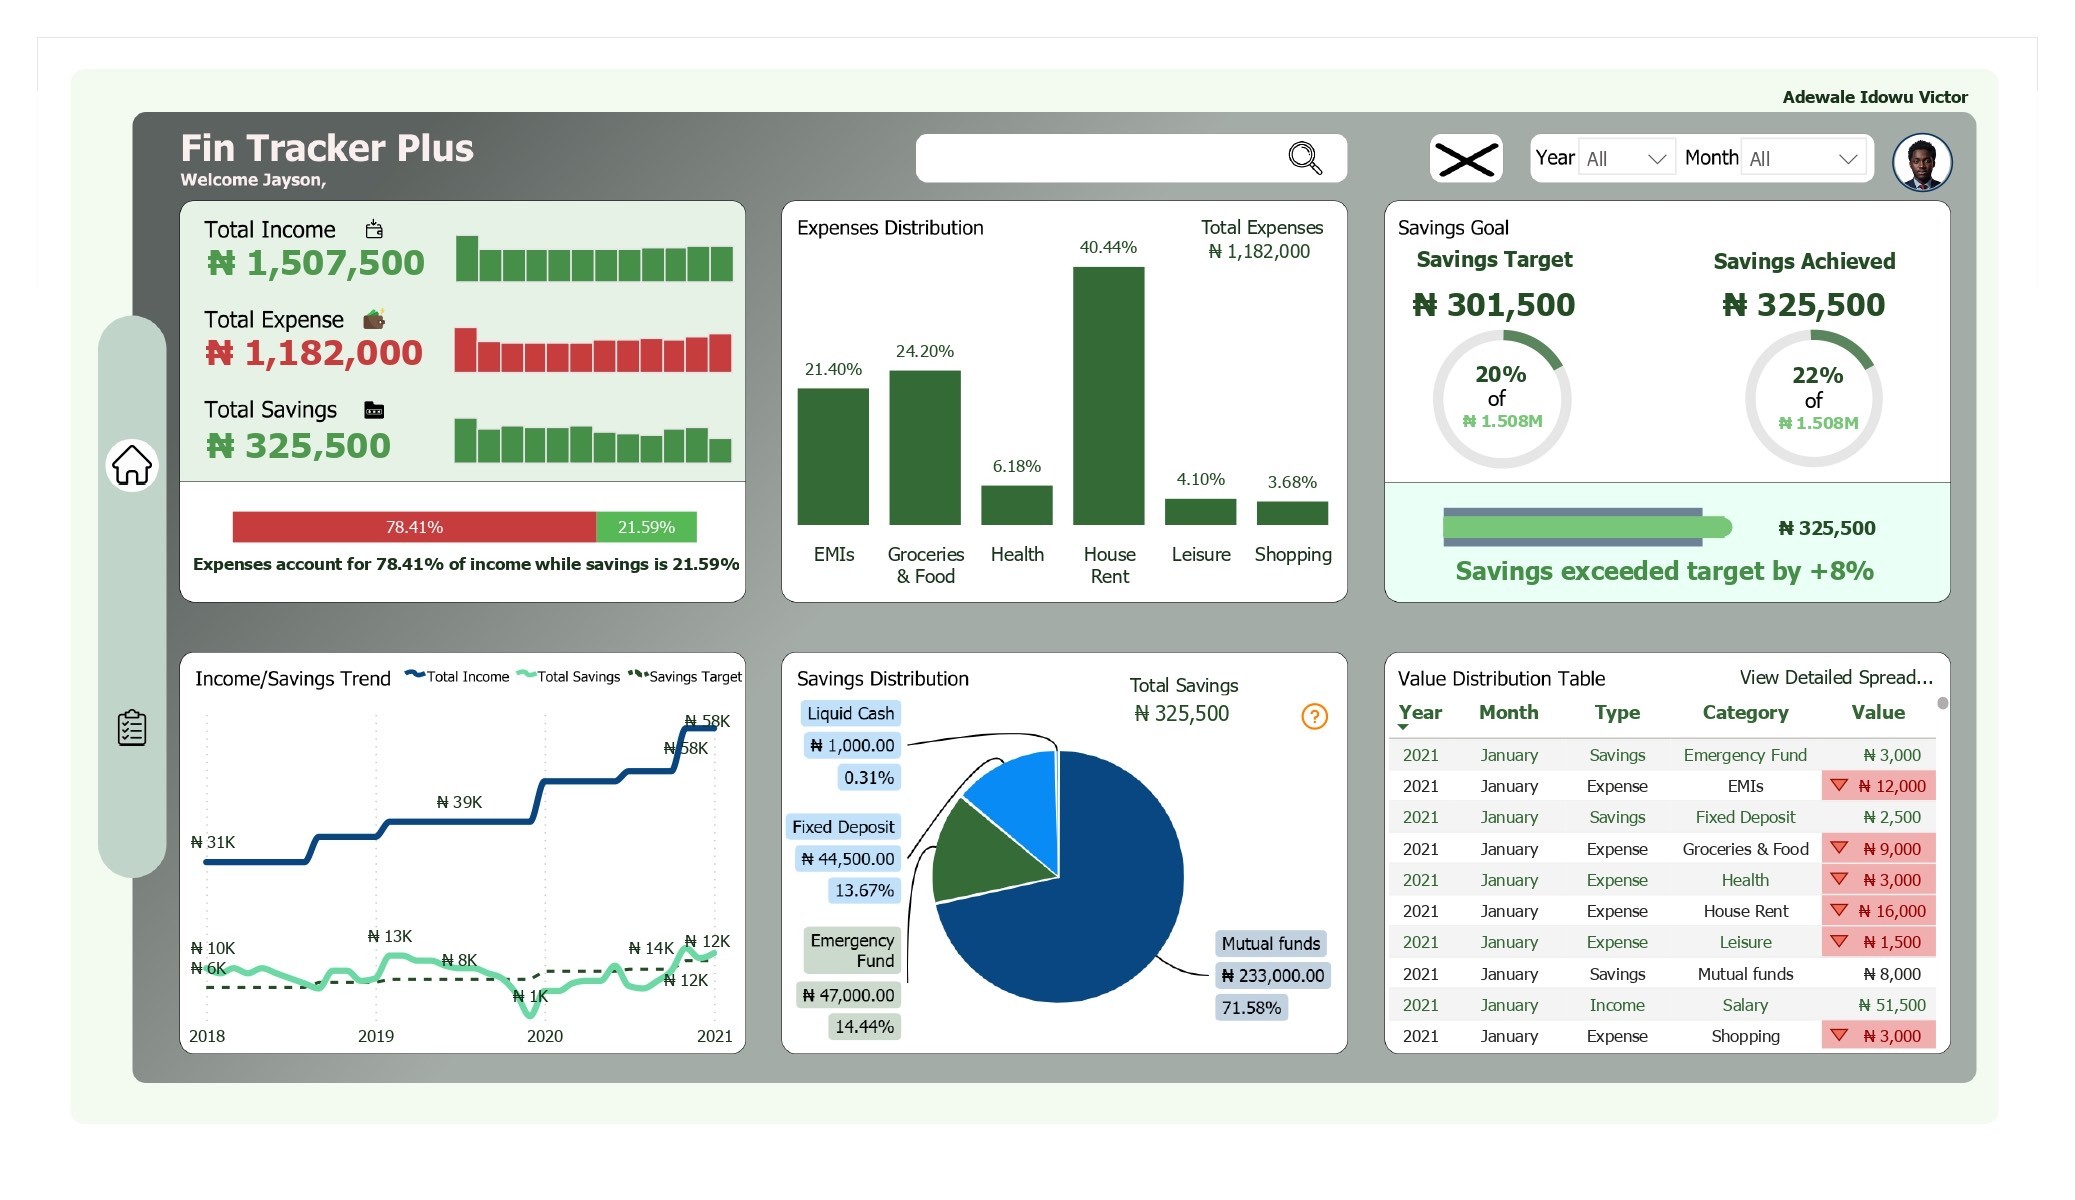
Personal Finance Tracker
Personal Finance Tracker
Summary of Incomes, Savings and Expenses Insight
Summary of Incomes, Savings and Expenses Insight

J&SONS FARM Sales Analysis
J&SONS FARM Sales Analysis
Implementing data-driven improvements
Implementing data-driven improvements

U.S. Population Dashboard (1950–2015)
U.S. Population Dashboard (1950–2015)
Demographic Trends for Healthcare Planning
Demographic Trends for Healthcare Planning

London Short-Let Market Analysis
London Short-Let Market Analysis
Uncovering Pricing, Host Behavior, and Market Opportunities Across 68K Property Listings
Uncovering Pricing, Host Behavior, and Market Opportunities Across 68K Property Listings

Telecom Customer Churn Analysis
Telecom Customer Churn Analysis
Identifying Churn Drivers and Revenue Risks to Improve Retention Strategy
Identifying Churn Drivers and Revenue Risks to Improve Retention Strategy

Product Sales Performance Dashboard
Product Sales Performance Dashboard
Identifying Revenue Drivers, Low-Margin Products, and Seasonal Trends Across SKUs
Identifying Revenue Drivers, Low-Margin Products, and Seasonal Trends Across SKUs

Customer Order Performance
Customer Order Performance
Optimizing Conversion, Segment Strategy, and Seasonal Sales Across Markets
Optimizing Conversion, Segment Strategy, and Seasonal Sales Across Markets