Role
Supply Chain & Operations Analyst
Industry
Retail & E-Commerce
Duration
2 Weeks
View Live Dashboard
Project Overview
The analysis provides a critical business intelligence snapshot of SuperStore’s current performance, focusing on the significant margin compression occurring during a period of high volume growth. The primary focus is comparing Current Year (CY) metrics against Previous Year (PY) to confirm the 28% surge in orders and units sold. The core financial mandate is profit optimization, as high sales volume is not translating efficiently into profit due to critically low margins in key categories (Chairs: 1.15%) and underlying logistic inefficiencies (4-day average delivery time).
Process, Steps, and Methodology
The visual dashboards were generated through a precise Business Intelligence workflow designed for comparative analysis:
Data Ingestion and Cleaning (Power Query): Raw transactional data was ingested, with Power Query (ETL) was used for robust data cleaning, standardization of formats, and preparation of fields for accurate aggregation.
Model Building and Calculation (DAX): A relational data model was established where all Key Performance Indicators (KPIs) and comparative metrics were calculated using DAX (Data Analysis Expressions). DAX enabled the precise calculation of year-over-year growth figures and the conditional logic for the CY vs. PY comparison.
Visualization and Segmentation: The final model was visualized across interactive dashboards, segmenting performance across time, geography, and product category to facilitate the rapid identification of growth drivers and risk areas.
Business Questions
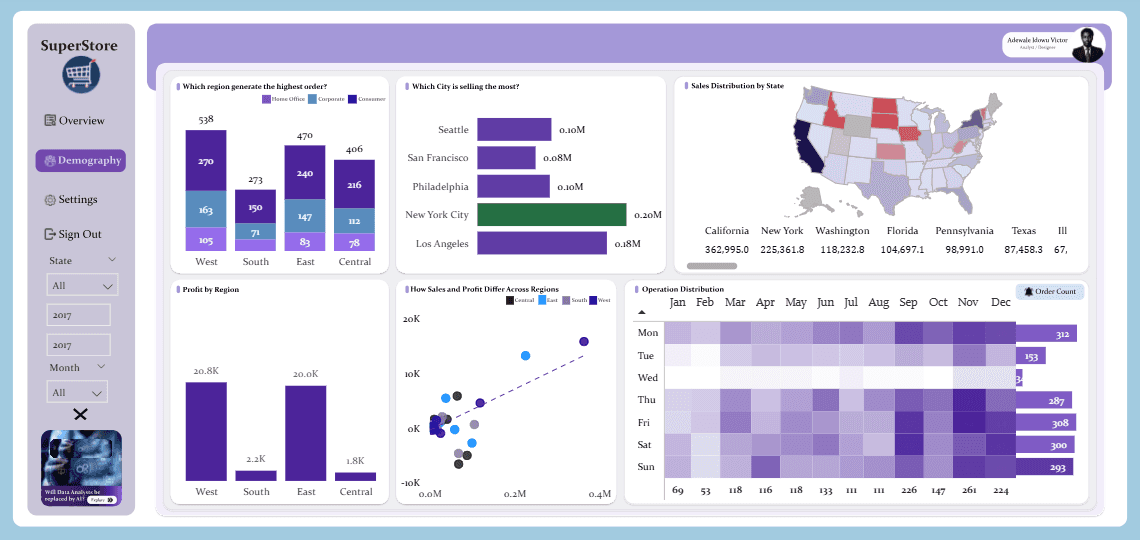
Which regions, states, and cities contribute most to revenue and profit?
Which areas are responsible for losses or low profitability?
Is there a relationship between sales and profit across states?
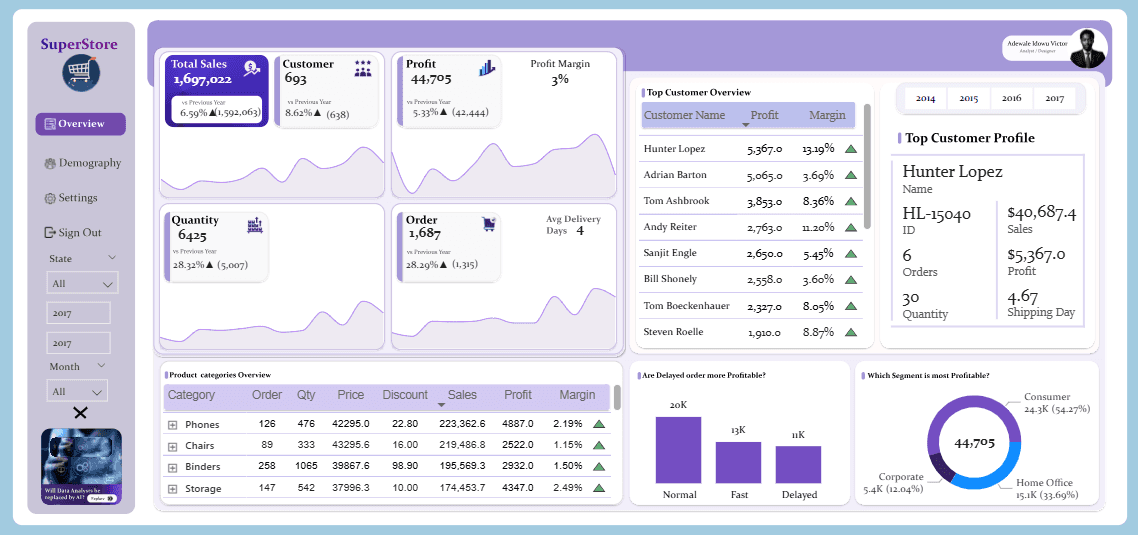
Who are the most valuable customers?
Which market segments are the most profitable?
What operational patterns exist across months and weekdays?
What strategic improvements can increase profitability and efficiency?
Objectives
Performance Evaluation & Growth Validation: Factually confirm the scale and balance of growth, especially the 28% surge in order volume and unit quantity.
Profit Optimization & Risk Management: Locate specific risk areas (low-margin products like Chairs) and identify profit leakage across regions.
Strategic Decision Support: Pinpoint the highest-value segments (Consumer) and dominant geographical regions (West/East) to guide resource allocation and market expansion.
Operational Improvement: Quantify logistical metrics (4-day Average Delivery) and analyze demand seasonality to optimize inventory and fulfillment processes.
Key Insights and Findings
· Growth & Financial Metrics (CY vs. PY)
Volume Acceleration: Orders reached 1,687 (a 28.29% increase), and Quantity reached 6,425 (a 28.32% increase from PY).
Sales & Profit: Total Sales for the current year is $1,697,022 (a 6.59% increase from the PY). Total Profit was $44,705 (a 5.33% increase from PY).
Margin Lag: The Profit Margin is 3%. Profit growth (5.33%) from PY lags behind both Sales and Volume growth, confirming that rising costs or aggressive discounting are compressing margins during expansion.
· Profit Drivers and Risks
Profit Engine: The Consumer segment is the most profitable, contributing 54.27% ($24.3K) of the total profit.
Top Customer (All Years): Hunter Lopez is the highest-value customer with $5,367 in profit, providing a reliable target for long-term retention.
High-Volume Risk: Phones generate the highest sales volume ($223.4K) in 2017 but yield a critical 2.19% profit margin.
· Diagnostic Analysis (Scatter Plot & Correlation)
Scatter Plot Insight: The scatter plot shows a weak positive correlation between sales and profit across regions. While higher sales slightly align with higher profit, most data points cluster near zero profit, indicating that many products generate strong sales but minimal or negative profit.
Profit–Sales Mismatch: The tight clustering near the midline suggests profitability is influenced by factors beyond sales volume, such as discounting, product mix, shipping cost, or regional cost structures. Sales alone do not guarantee strong profit performance.
· Geographical and Operational Facts
Regional Dominance: The West ($20.8K) and East ($20.0K) regions are the primary profit contributors, generating over 90% of the total profit.
Central Region: The Central Region's data points cluster in low-profit/loss-making zones on the scatter plot and contribute only $1.8K to total profit.
Operational Strain: The average delivery time is 4 days.
A significant volume of orders are categorized as 'Delayed,' which contributes less efficiently to profit ($11K) compared to Normal ($20K) and Fast ($13K) orders.
Seasonal Peaks: Demand spikes majorly during the festive/holiday months, with peak ordering seen in September, October, November, and December. Busiest days of the week include Friday, Saturday, Sunday, and Monday, indicating high weekend logistical strain.
Recommendations
The strategy must shift immediately to profit realization while sustaining volume growth:
Mandatory Chair Margin Intervention: Immediately review the cost structure and pricing of the Chairs category to raise its 1.15% margin, targeting a minimum of 4%. This is the highest priority margin intervention, followed closely by Binders (1.50%). Failure to act will severely cap future profit.
Logistics Improvement Focus: Implement a project to reduce the proportion of "Delayed" orders and drive down the 4-day average delivery time. Concurrently, optimize inventory and fulfillment processes specifically for the seasonal peak months (Nov/Dec) and high-volume weekends (Fri-Mon).
Strategic Resource Allocation: Prioritize investment (marketing, staffing) in the high-profit Consumer segment and the dominant West/East regions.
Profitability Check on Central Region: Immediately investigate the Central Region, which is characterized by low sales and negative profit, to identify structural inefficiencies in discounting or shipping costs and either correct them or re-evaluate market presence.
Expected Impacts
These recommendations will lead to measurable improvements in profitability and operational stability:
Profit Margin Expansion: Correcting the low-margin product risk is expected to elevate the overall company Profit Margin above 3%, resulting in a profit growth rate significantly higher than the current 5.31%.
Customer Lifetime Value (CLV) Increase: Reduced delivery delays and strengthened retention programs are projected to result in a 5–7% increase in CLV and higher customer satisfaction.
Operational Efficiency: Seasonal inventory alignment and improved logistics are expected to lead to reduced stockouts and faster fulfillment during peak demand periods.
Superstore Operational Efficiency & Sales Performance Analysis
Superstore Operational Efficiency & Sales Performance Analysis
Superstore Operational Efficiency & Sales Performance Analysis
A data-driven review of profitability and supply chain efficiency.
A data-driven review of profitability and supply chain efficiency.
Role
Supply Chain & Operations Analyst
Industry
Retail & E-Commerce
Duration
2 Weeks
Project Overview
The analysis provides a critical business intelligence snapshot of SuperStore’s current performance, focusing on the significant margin compression occurring during a period of high volume growth. The primary focus is comparing Current Year (CY) metrics against Previous Year (PY) to confirm the 28% surge in orders and units sold. The core financial mandate is profit optimization, as high sales volume is not translating efficiently into profit due to critically low margins in key categories (Chairs: 1.15%) and underlying logistic inefficiencies (4-day average delivery time).
Process, Steps, and Methodology
The visual dashboards were generated through a precise Business Intelligence workflow designed for comparative analysis:
Data Ingestion and Cleaning (Power Query): Raw transactional data was ingested, with Power Query (ETL) was used for robust data cleaning, standardization of formats, and preparation of fields for accurate aggregation.
Model Building and Calculation (DAX): A relational data model was established where all Key Performance Indicators (KPIs) and comparative metrics were calculated using DAX (Data Analysis Expressions). DAX enabled the precise calculation of year-over-year growth figures and the conditional logic for the CY vs. PY comparison.
Visualization and Segmentation: The final model was visualized across interactive dashboards, segmenting performance across time, geography, and product category to facilitate the rapid identification of growth drivers and risk areas.
Business Questions
Which regions, states, and cities contribute most to revenue and profit?
Which areas are responsible for losses or low profitability?
Is there a relationship between sales and profit across states?
Who are the most valuable customers?
Which market segments are the most profitable?
What operational patterns exist across months and weekdays?
What strategic improvements can increase profitability and efficiency?
Objectives
Performance Evaluation & Growth Validation: Factually confirm the scale and balance of growth, especially the 28% surge in order volume and unit quantity.
Profit Optimization & Risk Management: Locate specific risk areas (low-margin products like Chairs) and identify profit leakage across regions.
Strategic Decision Support: Pinpoint the highest-value segments (Consumer) and dominant geographical regions (West/East) to guide resource allocation and market expansion.
Operational Improvement: Quantify logistical metrics (4-day Average Delivery) and analyze demand seasonality to optimize inventory and fulfillment processes.
Key Insights and Findings
· Growth & Financial Metrics (CY vs. PY)
Volume Acceleration: Orders reached 1,687 (a 28.29% increase), and Quantity reached 6,425 (a 28.32% increase from PY).
Sales & Profit: Total Sales for the current year is $1,697,022 (a 6.59% increase from the PY). Total Profit was $44,705 (a 5.33% increase from PY).
Margin Lag: The Profit Margin is 3%. Profit growth (5.33%) from PY lags behind both Sales and Volume growth, confirming that rising costs or aggressive discounting are compressing margins during expansion.
· Profit Drivers and Risks
Profit Engine: The Consumer segment is the most profitable, contributing 54.27% ($24.3K) of the total profit.
Top Customer (All Years): Hunter Lopez is the highest-value customer with $5,367 in profit, providing a reliable target for long-term retention.
High-Volume Risk: Phones generate the highest sales volume ($223.4K) in 2017 but yield a critical 2.19% profit margin.
· Diagnostic Analysis (Scatter Plot & Correlation)
Scatter Plot Insight: The scatter plot shows a weak positive correlation between sales and profit across regions. While higher sales slightly align with higher profit, most data points cluster near zero profit, indicating that many products generate strong sales but minimal or negative profit.
Profit–Sales Mismatch: The tight clustering near the midline suggests profitability is influenced by factors beyond sales volume, such as discounting, product mix, shipping cost, or regional cost structures. Sales alone do not guarantee strong profit performance.
· Geographical and Operational Facts
Regional Dominance: The West ($20.8K) and East ($20.0K) regions are the primary profit contributors, generating over 90% of the total profit.
Central Region: The Central Region's data points cluster in low-profit/loss-making zones on the scatter plot and contribute only $1.8K to total profit.
Operational Strain: The average delivery time is 4 days.
A significant volume of orders are categorized as 'Delayed,' which contributes less efficiently to profit ($11K) compared to Normal ($20K) and Fast ($13K) orders.
Seasonal Peaks: Demand spikes majorly during the festive/holiday months, with peak ordering seen in September, October, November, and December. Busiest days of the week include Friday, Saturday, Sunday, and Monday, indicating high weekend logistical strain.
Recommendations
The strategy must shift immediately to profit realization while sustaining volume growth:
Mandatory Chair Margin Intervention: Immediately review the cost structure and pricing of the Chairs category to raise its 1.15% margin, targeting a minimum of 4%. This is the highest priority margin intervention, followed closely by Binders (1.50%). Failure to act will severely cap future profit.
Logistics Improvement Focus: Implement a project to reduce the proportion of "Delayed" orders and drive down the 4-day average delivery time. Concurrently, optimize inventory and fulfillment processes specifically for the seasonal peak months (Nov/Dec) and high-volume weekends (Fri-Mon).
Strategic Resource Allocation: Prioritize investment (marketing, staffing) in the high-profit Consumer segment and the dominant West/East regions.
Profitability Check on Central Region: Immediately investigate the Central Region, which is characterized by low sales and negative profit, to identify structural inefficiencies in discounting or shipping costs and either correct them or re-evaluate market presence.
Expected Impacts
These recommendations will lead to measurable improvements in profitability and operational stability:
Profit Margin Expansion: Correcting the low-margin product risk is expected to elevate the overall company Profit Margin above 3%, resulting in a profit growth rate significantly higher than the current 5.31%.
Customer Lifetime Value (CLV) Increase: Reduced delivery delays and strengthened retention programs are projected to result in a 5–7% increase in CLV and higher customer satisfaction.
Operational Efficiency: Seasonal inventory alignment and improved logistics are expected to lead to reduced stockouts and faster fulfillment during peak demand periods.
View Document

Electricity Consumption & Loss Analysis
Electricity Consumption & Loss Analysis
Assessing regional, income-based, and efficiency disparities
Assessing regional, income-based, and efficiency disparities

Facility Operations Service Request & Maintenance Performance Dashboard
Facility Operations Service Request & Maintenance Performance Dashboard
Operational analytics system for tracking resident complaints, monitoring maintenance performance, and identifying recurring infrastructure issues across residential blocks.
Operational analytics system for tracking resident complaints, monitoring maintenance performance, and identifying recurring infrastructure issues across residential blocks.

Facility Operations & Maintenance Performance Analysis
Facility Operations & Maintenance Performance Analysis
A data-driven review of maintenance demand, service efficiency, and infrastructure performance.
A data-driven review of maintenance demand, service efficiency, and infrastructure performance.

Metro Bank Analytics
Metro Bank Analytics
A Customer Experience and Risk Audit
A Customer Experience and Risk Audit
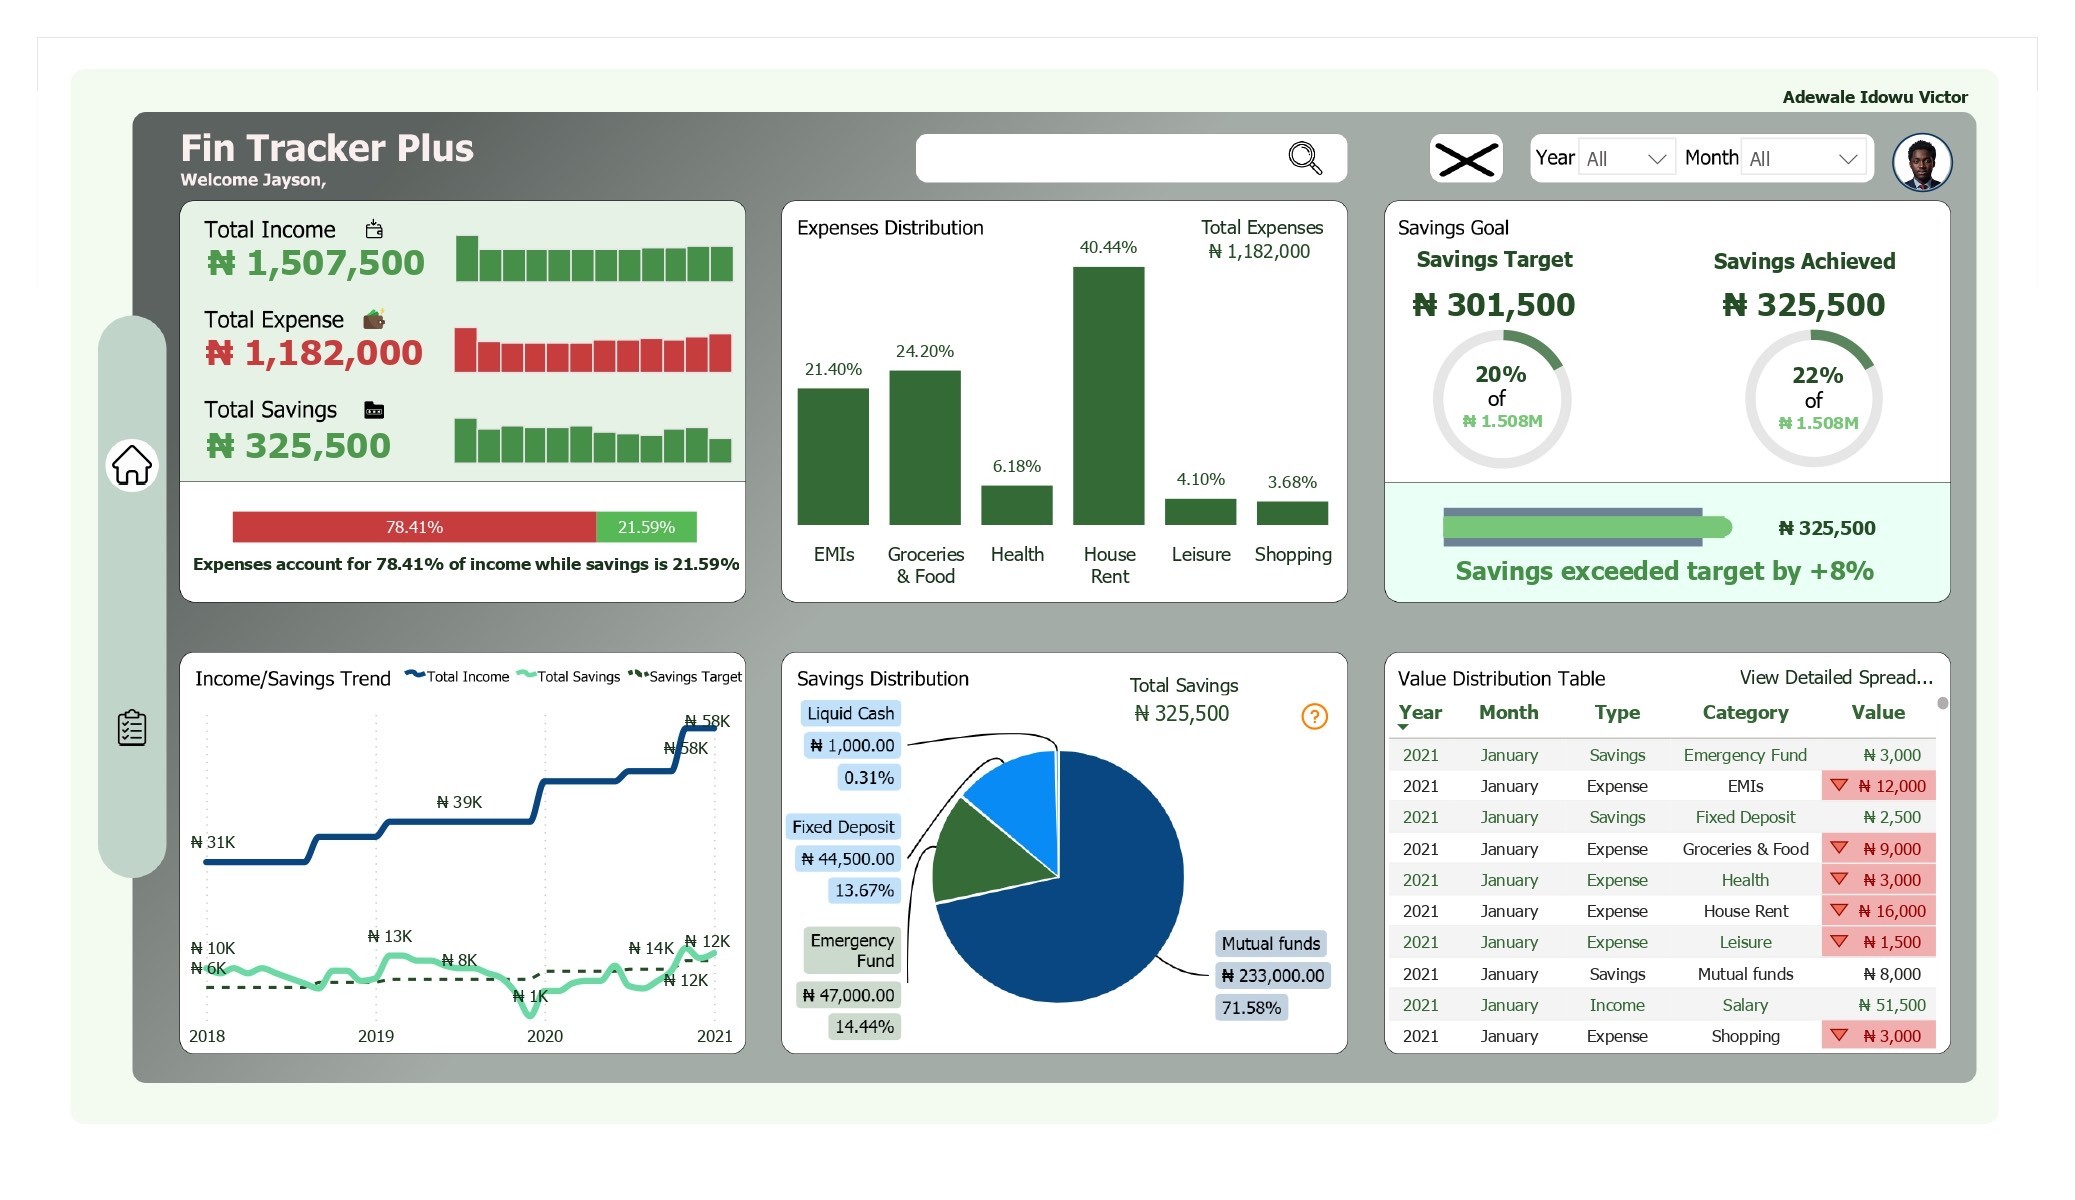
Personal Finance Tracker
Personal Finance Tracker
Summary of Incomes, Savings and Expenses Insight
Summary of Incomes, Savings and Expenses Insight

J&SONS FARM Sales Analysis
J&SONS FARM Sales Analysis
Implementing data-driven improvements
Implementing data-driven improvements

Digital Marketing Campaign Analysis
Digital Marketing Campaign Analysis
Analyzing February 2025 Campaigns to Maximize Profitability and Conversion
Analyzing February 2025 Campaigns to Maximize Profitability and Conversion

U.S. Population Dashboard (1950–2015)
U.S. Population Dashboard (1950–2015)
Demographic Trends for Healthcare Planning
Demographic Trends for Healthcare Planning

London Short-Let Market Analysis
London Short-Let Market Analysis
Uncovering Pricing, Host Behavior, and Market Opportunities Across 68K Property Listings
Uncovering Pricing, Host Behavior, and Market Opportunities Across 68K Property Listings

Telecom Customer Churn Analysis
Telecom Customer Churn Analysis
Identifying Churn Drivers and Revenue Risks to Improve Retention Strategy
Identifying Churn Drivers and Revenue Risks to Improve Retention Strategy

Product Sales Performance Dashboard
Product Sales Performance Dashboard
Identifying Revenue Drivers, Low-Margin Products, and Seasonal Trends Across SKUs
Identifying Revenue Drivers, Low-Margin Products, and Seasonal Trends Across SKUs

Customer Order Performance
Customer Order Performance
Optimizing Conversion, Segment Strategy, and Seasonal Sales Across Markets
Optimizing Conversion, Segment Strategy, and Seasonal Sales Across Markets