Role
Data Analyst
Industry
Agriculture
Duration
2 weeks
View Live Dashboard
View Live Dashboard
Project Overview
This project analyzes four months of sales and customer activity for J&SONS Farm, focusing on fish-type performance, customer behavior, and month-to-month volume trends. Using Power Query, DAX, and Power BI, the raw farm records were transformed into a structured analytical model that reveals growth patterns, top buyers, and key revenue drivers in the aquaculture business.
Process & Methodology
Data Cleaning & Transformation (Power Query)
Raw transactional records were manually cleaned, standardized, and validated. Product categories were unified into Mixed, Post, Standard, and Juvenile. Duplicates, inconsistent dates, and missing quantities were resolved to ensure accurate aggregation.
Data Modeling & KPI Development (DAX)
A streamlined star-model was created, enabling month-level analysis, customer segmentation, and product category comparison. Core KPIs (Total Units Sold, Customer Count, Transaction Count, and Month-over-Month (MoM) Growth) were built with DAX.
Visualization & Insight Design
Interactive Power BI visuals were developed:
Monthly sales trend
Fish-type performance
Customer ranking table
Transaction count by month
This structure highlights the business drivers and allows quick comparison across months.
Business Questions
How strong is monthly sales growth within the four-month period?
Which fish categories contribute most to total volume?
Who are the highest-value customers?
How evenly are transactions and quantities distributed across the months?
What early trends indicate opportunities for growth or risks of over-dependence?
Objectives
Quantify growth and validate the 101.88% MoM surge.
Identify top contributors among fish categories and customers.
Understand customer concentration and purchasing behavior.
Provide a clear summary of sales trends for leadership decision-making.
Key Insights & Findings
Growth & Volume Performance
Total Units Sold: 1,392,148
Customer Count: 51
Transactions: 162
The business recorded a 101.88% month-over-month increase, indicating a major spike in demand.
Sales peaked in June (690K units) before dropping to 482K in July.
Monthly Trend (April → July)
April: 108K
May: 113K
June: 690K (peak)
July: 482K
The data shows a sharp growth curve into June, followed by a correction in July.
Fish-Type Performance
Mixed fish type dominates the dataset at 0.66M units.
Post follows at 0.38M, then Standard (0.23M) and Juvenile (0.10M).
Mixed is the clear volume leader and key to revenue stability.
Customer Insights
Top Buyer: Bro Oye, 477,958 units, far exceeding every other customer.
Other customers contribute far smaller shares.
This reveals strong customer concentration, where one buyer accounts for a disproportionately large share of total volume.
Transaction Patterns
July recorded the highest number of transactions (84) but not the highest quantity.
June had fewer transactions but extremely high quantities, indicating bulk-order behavior in that month.
Recommendations
Validate June spike: Confirm if the surge reflects market demand, promotional sales, or bulk one-off orders.
Monitor customer concentration: Track Bro Oye’s monthly contribution and diversify the customer base to reduce single-buyer dependency.
Deepen product-type analysis: Evaluate margins by fish category to understand whether volume aligns with profitability (if cost data becomes available).
Create monthly forecasts: Establish a short-term forecasting model to anticipate high-volume months and plan data-driven decision-making.
Expand dashboard KPIs: Add revenue, unit price, and customer tenure to improve future insight depth.
Expected Impact
Stronger understanding of growth patterns and month-to-month volatility.
Improved strategic focus on high-value customers and high-volume fish categories.
Better data visibility for planning, reporting, and commercial decisions within the aquaculture business.
J&SONS FARM Sales Analysis
J&SONS FARM Sales Analysis
J&SONS FARM Sales Analysis
Implementing data-driven improvements
Implementing data-driven improvements
Role
Data Analyst
Industry
Agriculture
Duration
2 weeks

View Live Dashboard
Project Overview
This project analyzes four months of sales and customer activity for J&SONS Farm, focusing on fish-type performance, customer behavior, and month-to-month volume trends. Using Power Query, DAX, and Power BI, the raw farm records were transformed into a structured analytical model that reveals growth patterns, top buyers, and key revenue drivers in the aquaculture business.
Process & Methodology
Data Cleaning & Transformation (Power Query)
Raw transactional records were manually cleaned, standardized, and validated. Product categories were unified into Mixed, Post, Standard, and Juvenile. Duplicates, inconsistent dates, and missing quantities were resolved to ensure accurate aggregation.
Data Modeling & KPI Development (DAX)
A streamlined star-model was created, enabling month-level analysis, customer segmentation, and product category comparison. Core KPIs (Total Units Sold, Customer Count, Transaction Count, and Month-over-Month (MoM) Growth) were built with DAX.
Visualization & Insight Design
Interactive Power BI visuals were developed:
Monthly sales trend
Fish-type performance
Customer ranking table
Transaction count by month
This structure highlights the business drivers and allows quick comparison across months.
Business Questions
How strong is monthly sales growth within the four-month period?
Which fish categories contribute most to total volume?
Who are the highest-value customers?
How evenly are transactions and quantities distributed across the months?
What early trends indicate opportunities for growth or risks of over-dependence?
Objectives
Quantify growth and validate the 101.88% MoM surge.
Identify top contributors among fish categories and customers.
Understand customer concentration and purchasing behavior.
Provide a clear summary of sales trends for leadership decision-making.
Key Insights & Findings
Growth & Volume Performance
Total Units Sold: 1,392,148
Customer Count: 51
Transactions: 162
The business recorded a 101.88% month-over-month increase, indicating a major spike in demand.
Sales peaked in June (690K units) before dropping to 482K in July.
Monthly Trend (April → July)
April: 108K
May: 113K
June: 690K (peak)
July: 482K
The data shows a sharp growth curve into June, followed by a correction in July.
Fish-Type Performance
Mixed fish type dominates the dataset at 0.66M units.
Post follows at 0.38M, then Standard (0.23M) and Juvenile (0.10M).
Mixed is the clear volume leader and key to revenue stability.
Customer Insights
Top Buyer: Bro Oye, 477,958 units, far exceeding every other customer.
Other customers contribute far smaller shares.
This reveals strong customer concentration, where one buyer accounts for a disproportionately large share of total volume.
Transaction Patterns
July recorded the highest number of transactions (84) but not the highest quantity.
June had fewer transactions but extremely high quantities, indicating bulk-order behavior in that month.
Recommendations
Validate June spike: Confirm if the surge reflects market demand, promotional sales, or bulk one-off orders.
Monitor customer concentration: Track Bro Oye’s monthly contribution and diversify the customer base to reduce single-buyer dependency.
Deepen product-type analysis: Evaluate margins by fish category to understand whether volume aligns with profitability (if cost data becomes available).
Create monthly forecasts: Establish a short-term forecasting model to anticipate high-volume months and plan data-driven decision-making.
Expand dashboard KPIs: Add revenue, unit price, and customer tenure to improve future insight depth.
Expected Impact
Stronger understanding of growth patterns and month-to-month volatility.
Improved strategic focus on high-value customers and high-volume fish categories.
Better data visibility for planning, reporting, and commercial decisions within the aquaculture business.
View Document

Electricity Consumption & Loss Analysis
Electricity Consumption & Loss Analysis
Assessing regional, income-based, and efficiency disparities
Assessing regional, income-based, and efficiency disparities

Facility Operations Service Request & Maintenance Performance Dashboard
Facility Operations Service Request & Maintenance Performance Dashboard
Operational analytics system for tracking resident complaints, monitoring maintenance performance, and identifying recurring infrastructure issues across residential blocks.
Operational analytics system for tracking resident complaints, monitoring maintenance performance, and identifying recurring infrastructure issues across residential blocks.
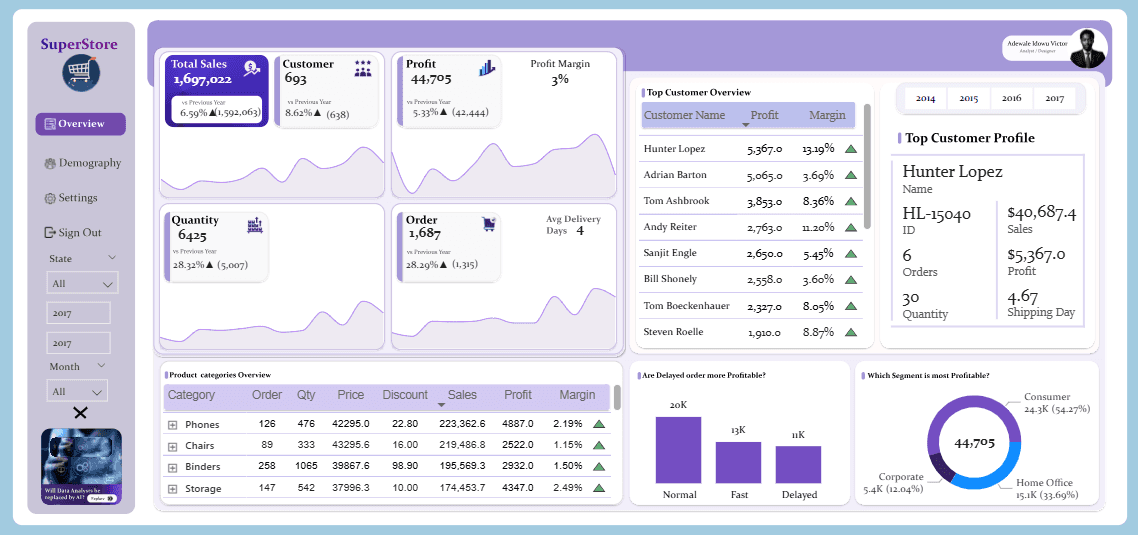
Superstore Operational Efficiency & Sales Performance Analysis
Superstore Operational Efficiency & Sales Performance Analysis
A data-driven review of profitability and supply chain efficiency.
A data-driven review of profitability and supply chain efficiency.

Facility Operations & Maintenance Performance Analysis
Facility Operations & Maintenance Performance Analysis
A data-driven review of maintenance demand, service efficiency, and infrastructure performance.
A data-driven review of maintenance demand, service efficiency, and infrastructure performance.

Metro Bank Analytics
Metro Bank Analytics
A Customer Experience and Risk Audit
A Customer Experience and Risk Audit
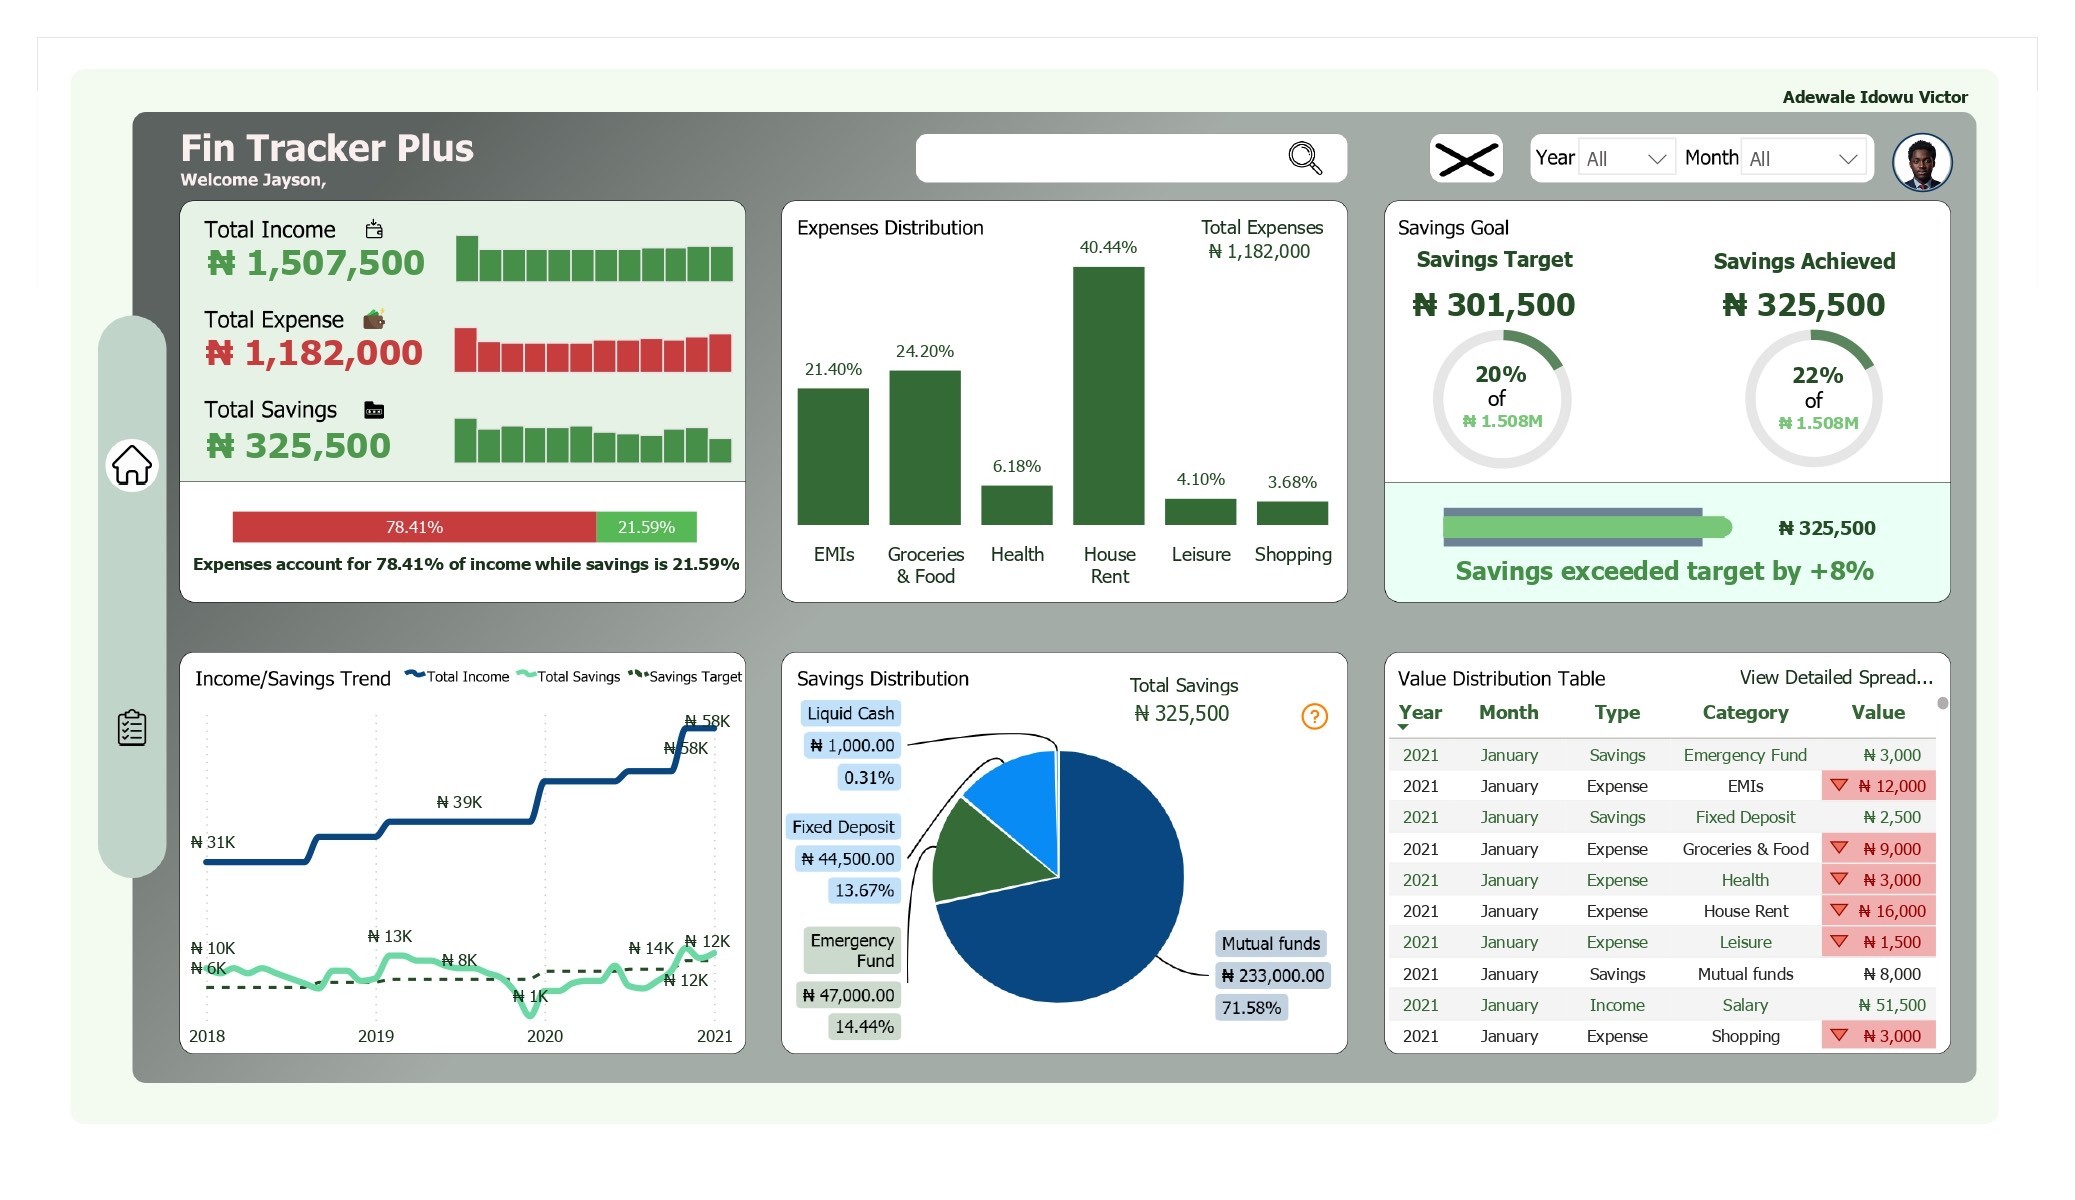
Personal Finance Tracker
Personal Finance Tracker
Summary of Incomes, Savings and Expenses Insight
Summary of Incomes, Savings and Expenses Insight

Digital Marketing Campaign Analysis
Digital Marketing Campaign Analysis
Analyzing February 2025 Campaigns to Maximize Profitability and Conversion
Analyzing February 2025 Campaigns to Maximize Profitability and Conversion

U.S. Population Dashboard (1950–2015)
U.S. Population Dashboard (1950–2015)
Demographic Trends for Healthcare Planning
Demographic Trends for Healthcare Planning

London Short-Let Market Analysis
London Short-Let Market Analysis
Uncovering Pricing, Host Behavior, and Market Opportunities Across 68K Property Listings
Uncovering Pricing, Host Behavior, and Market Opportunities Across 68K Property Listings

Telecom Customer Churn Analysis
Telecom Customer Churn Analysis
Identifying Churn Drivers and Revenue Risks to Improve Retention Strategy
Identifying Churn Drivers and Revenue Risks to Improve Retention Strategy

Product Sales Performance Dashboard
Product Sales Performance Dashboard
Identifying Revenue Drivers, Low-Margin Products, and Seasonal Trends Across SKUs
Identifying Revenue Drivers, Low-Margin Products, and Seasonal Trends Across SKUs

Customer Order Performance
Customer Order Performance
Optimizing Conversion, Segment Strategy, and Seasonal Sales Across Markets
Optimizing Conversion, Segment Strategy, and Seasonal Sales Across Markets