Role
Data Analyst
Industry
Finance
Duration
3 Days
View Live Dashboard
Overview
This project analyzes a sample personal finance dataset representing a single individual. The dataset is a case study to demonstrate income tracking, expense analysis, savings evaluation, and target-based financial monitoring. It does not represent my personal financial data.
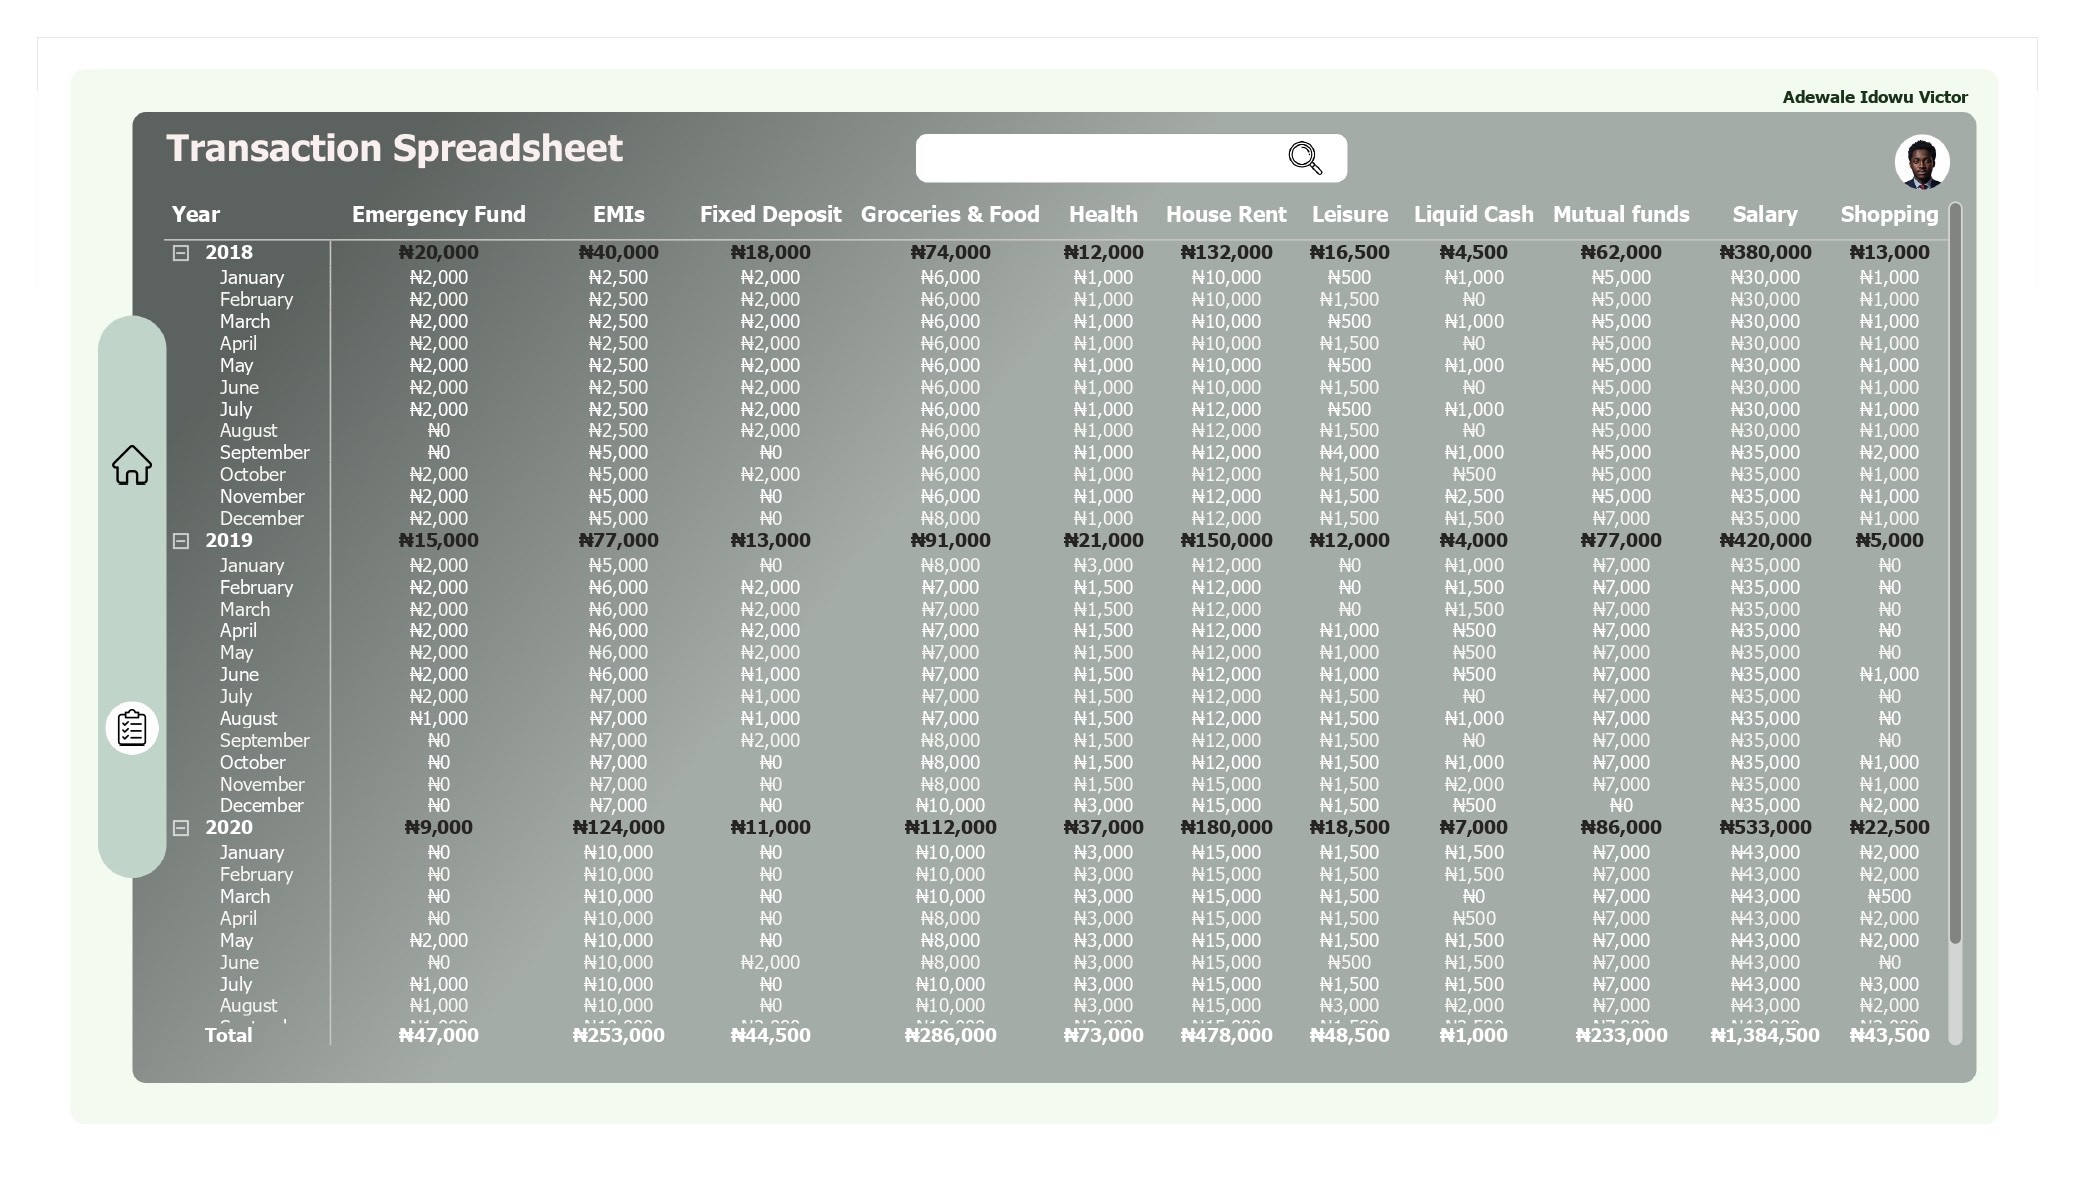
Methodology
Financial transactions were structured by year, month, type (Income, Expense, Savings), category, and value. Using Power BI and DAX, key metrics were modeled, including total income, total expenses, total savings, savings rate, and savings target variance. Interactive visuals were designed to support trend analysis, allocation breakdowns, and performance monitoring.

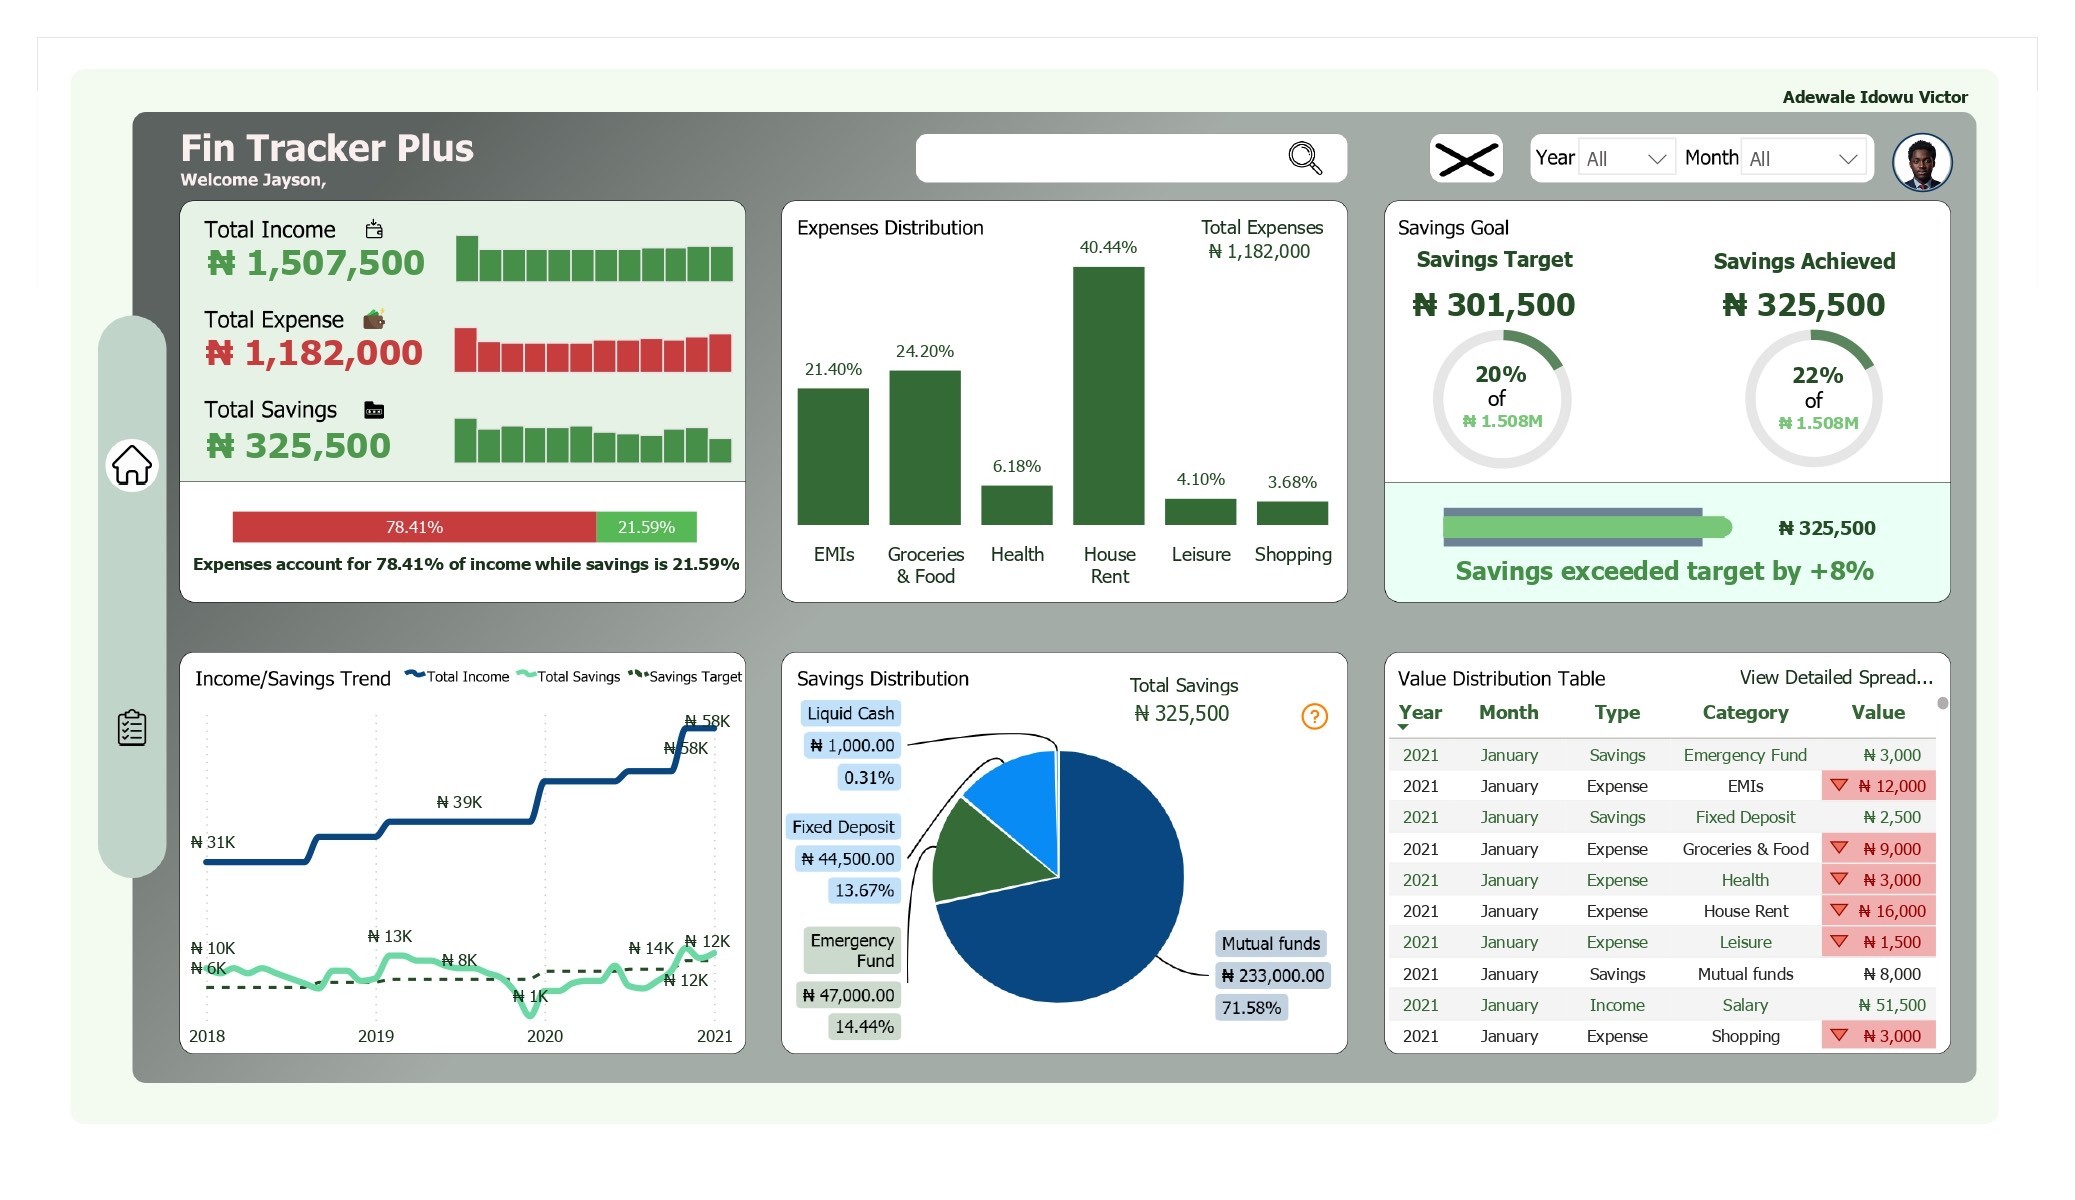
Key Insights
Total Income: ₦1,507,500
Total Expenses: ₦1,182,000
Total Savings: ₦325,500
Expenses account for 78.41% of income, while savings represent 21.59%.
Savings exceeded the target of ₦301,500 by approximately 8%.
Expense concentration is driven mainly by fixed costs:
House Rent: 40.44%
Groceries & Food: 24.20%
EMIs: 21.40%
Discretionary expenses remain minimal (below 8%).
Savings allocation favors long-term instruments:
Mutual Funds: 71.58%
Emergency Fund: 14.44%
Fixed Deposit: 13.67%
Liquid Cash: 0.31%
Interpretation
The analysis shows that high expense ratios are primarily necessity-driven rather than discretionary. Despite this structure, savings discipline remains strong, supported by consistent tracking against predefined targets.
Outcome
The dashboard provides clear financial visibility, supports informed decision-making, and demonstrates how structured analysis of can improve financial awareness and planning.
Personal Finance Tracker
Personal Finance Tracker
Personal Finance Tracker
Summary of Incomes, Savings and Expenses Insight
Summary of Incomes, Savings and Expenses Insight
Role
Data Analyst
Industry
Finance
Duration
3 Days
Overview
This project analyzes a sample personal finance dataset representing a single individual. The dataset is a case study to demonstrate income tracking, expense analysis, savings evaluation, and target-based financial monitoring. It does not represent my personal financial data.
Methodology
Financial transactions were structured by year, month, type (Income, Expense, Savings), category, and value. Using Power BI and DAX, key metrics were modeled, including total income, total expenses, total savings, savings rate, and savings target variance. Interactive visuals were designed to support trend analysis, allocation breakdowns, and performance monitoring.
Key Insights
Total Income: ₦1,507,500
Total Expenses: ₦1,182,000
Total Savings: ₦325,500
Expenses account for 78.41% of income, while savings represent 21.59%.
Savings exceeded the target of ₦301,500 by approximately 8%.
Expense concentration is driven mainly by fixed costs:
House Rent: 40.44%
Groceries & Food: 24.20%
EMIs: 21.40%
Discretionary expenses remain minimal (below 8%).
Savings allocation favors long-term instruments:
Mutual Funds: 71.58%
Emergency Fund: 14.44%
Fixed Deposit: 13.67%
Liquid Cash: 0.31%
Interpretation
The analysis shows that high expense ratios are primarily necessity-driven rather than discretionary. Despite this structure, savings discipline remains strong, supported by consistent tracking against predefined targets.
Outcome
The dashboard provides clear financial visibility, supports informed decision-making, and demonstrates how structured analysis of can improve financial awareness and planning.
View Document

Electricity Consumption & Loss Analysis
Electricity Consumption & Loss Analysis
Assessing regional, income-based, and efficiency disparities
Assessing regional, income-based, and efficiency disparities

Facility Operations Service Request & Maintenance Performance Dashboard
Facility Operations Service Request & Maintenance Performance Dashboard
Operational analytics system for tracking resident complaints, monitoring maintenance performance, and identifying recurring infrastructure issues across residential blocks.
Operational analytics system for tracking resident complaints, monitoring maintenance performance, and identifying recurring infrastructure issues across residential blocks.
Superstore Operational Efficiency & Sales Performance Analysis
Superstore Operational Efficiency & Sales Performance Analysis
A data-driven review of profitability and supply chain efficiency.
A data-driven review of profitability and supply chain efficiency.

Facility Operations & Maintenance Performance Analysis
Facility Operations & Maintenance Performance Analysis
A data-driven review of maintenance demand, service efficiency, and infrastructure performance.
A data-driven review of maintenance demand, service efficiency, and infrastructure performance.

Metro Bank Analytics
Metro Bank Analytics
A Customer Experience and Risk Audit
A Customer Experience and Risk Audit

J&SONS FARM Sales Analysis
J&SONS FARM Sales Analysis
Implementing data-driven improvements
Implementing data-driven improvements

Digital Marketing Campaign Analysis
Digital Marketing Campaign Analysis
Analyzing February 2025 Campaigns to Maximize Profitability and Conversion
Analyzing February 2025 Campaigns to Maximize Profitability and Conversion

U.S. Population Dashboard (1950–2015)
U.S. Population Dashboard (1950–2015)
Demographic Trends for Healthcare Planning
Demographic Trends for Healthcare Planning

London Short-Let Market Analysis
London Short-Let Market Analysis
Uncovering Pricing, Host Behavior, and Market Opportunities Across 68K Property Listings
Uncovering Pricing, Host Behavior, and Market Opportunities Across 68K Property Listings

Telecom Customer Churn Analysis
Telecom Customer Churn Analysis
Identifying Churn Drivers and Revenue Risks to Improve Retention Strategy
Identifying Churn Drivers and Revenue Risks to Improve Retention Strategy

Product Sales Performance Dashboard
Product Sales Performance Dashboard
Identifying Revenue Drivers, Low-Margin Products, and Seasonal Trends Across SKUs
Identifying Revenue Drivers, Low-Margin Products, and Seasonal Trends Across SKUs

Customer Order Performance
Customer Order Performance
Optimizing Conversion, Segment Strategy, and Seasonal Sales Across Markets
Optimizing Conversion, Segment Strategy, and Seasonal Sales Across Markets