Role
Data Analyst
Industry
Energy | Economic Development
Duration
2 weeks
View Live Dashboard
Project Overview
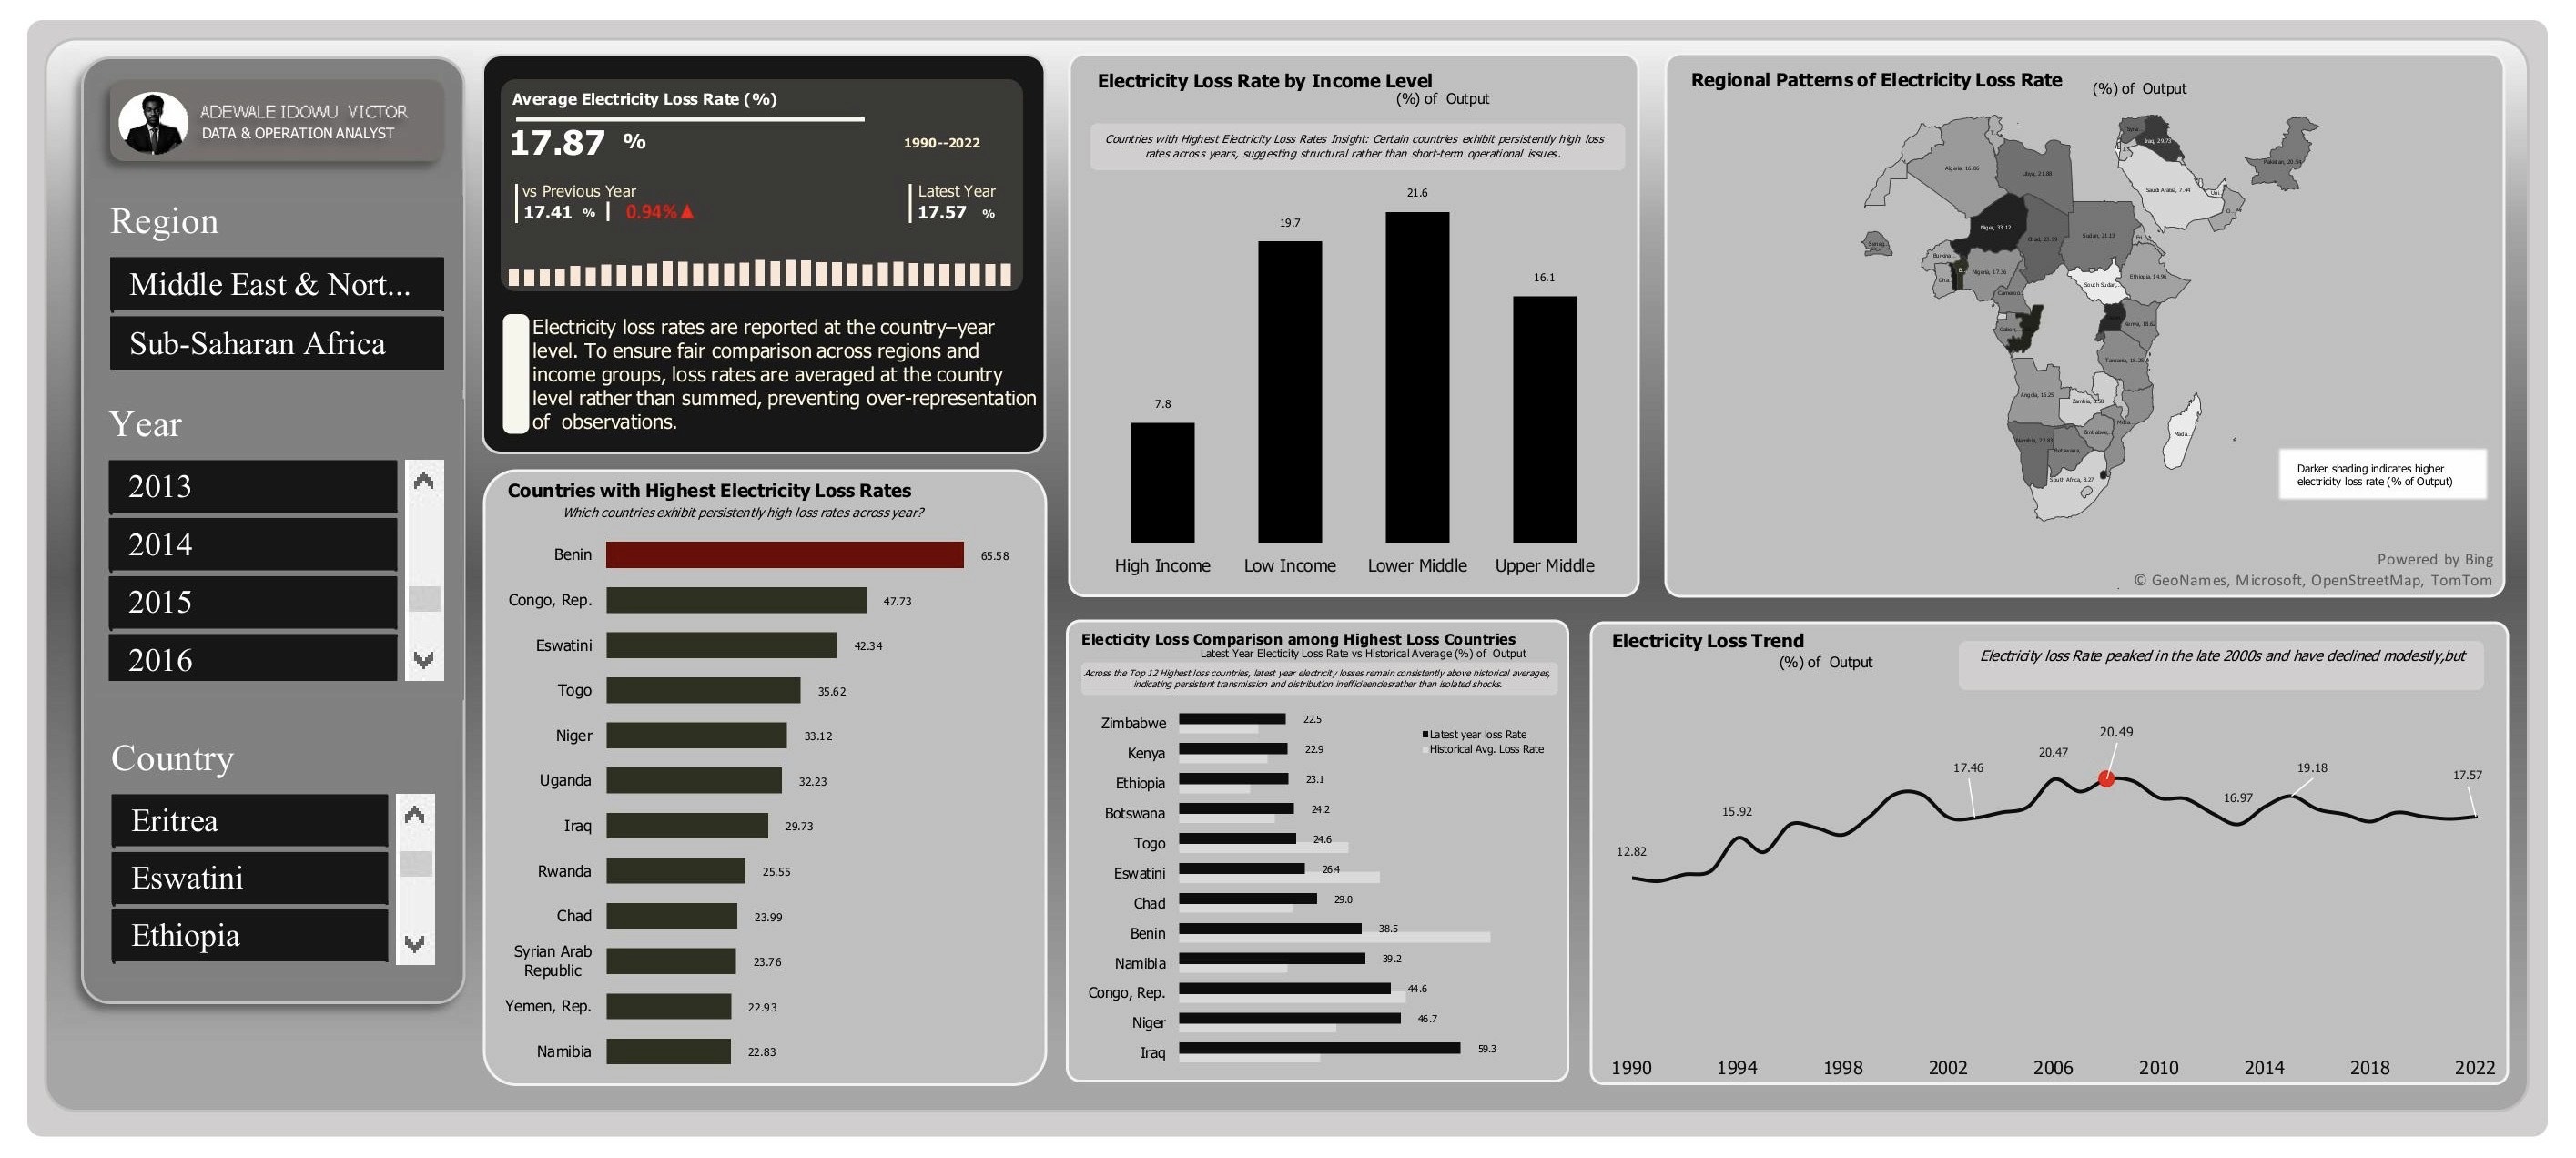
This project analyzes electricity consumption and system losses across African and MENA countries, focusing on per-capita usage, income-level disparities, electricity loss rates, and long-term trends.
Using World Bank data in Excel, raw multi-year energy records were transformed into a structured analytical model that reveals where electricity access is constrained, where inefficiencies persist, and how income and region influence energy outcomes.
Process & Methodology
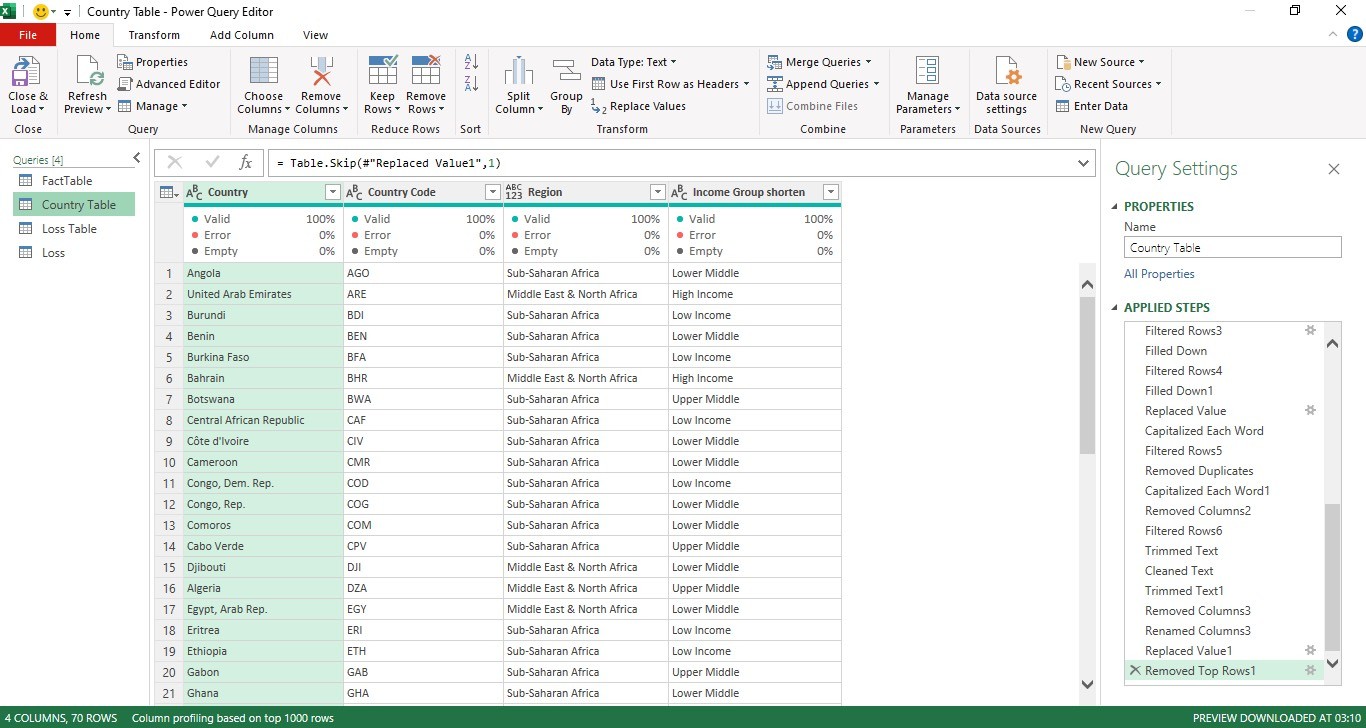
Data Cleaning & Transformation (Excel Power Query)
Unpivoted year-based columns into a time-series format
Removed blank and inconsistent records
Standardized country names and classifications
Enriched missing income-level data to ensure accurate segmentation
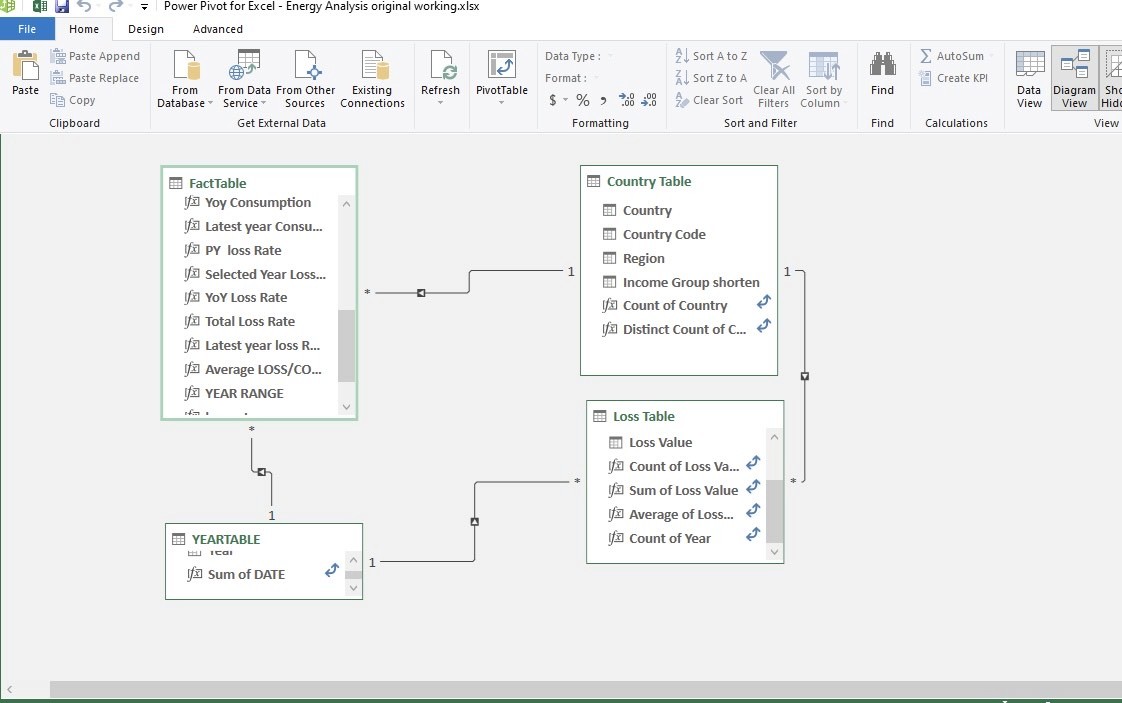
Data Modeling & KPI Development (Power Pivot / DAX)
Built a structured data model using Country, Region, Income Level, and Date tables
Resolved filter inconsistencies by aligning fact and dimension tables
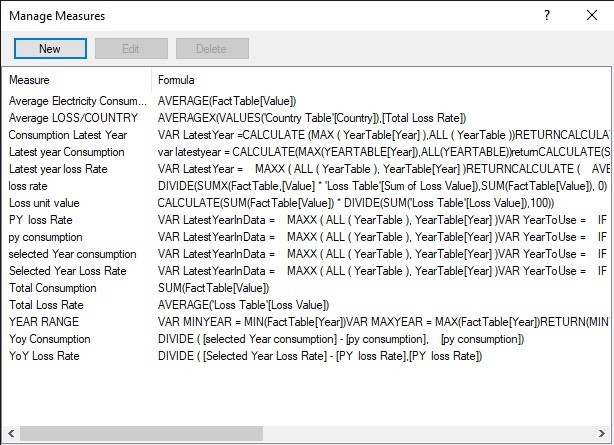
Developed KPIs for:
Electricity consumption per capita
Electricity loss rate (% of output)
Income-level and regional averages
Year-over-year and long-term trends
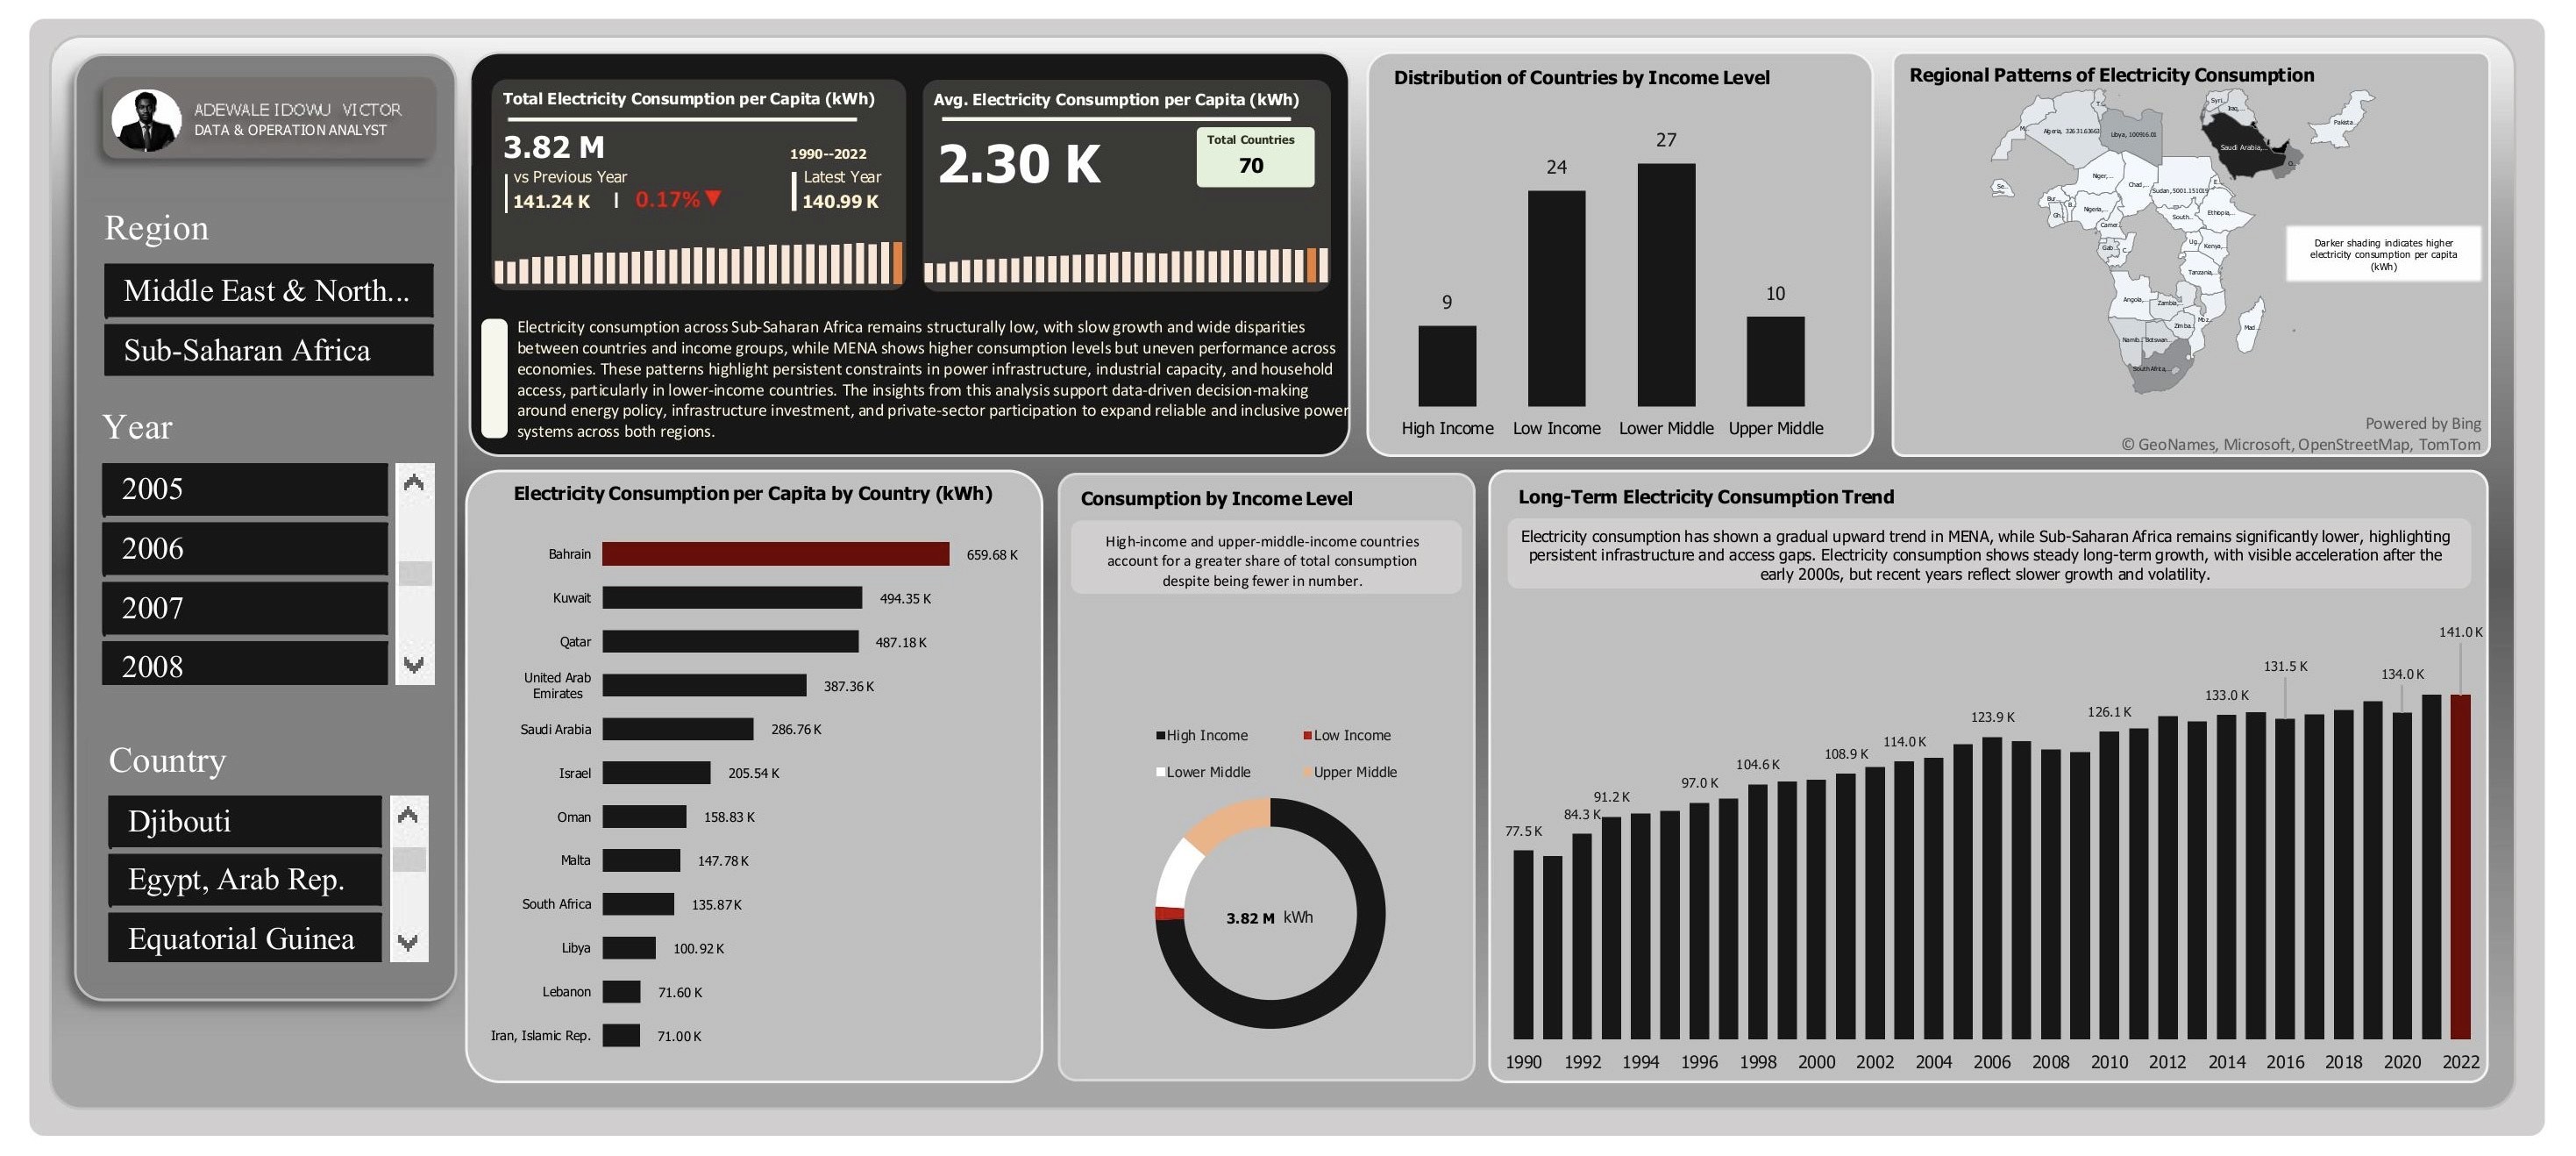
Visualization & Insight Design (Excel Dashboards)
KPI cards for consumption and loss metrics
Ranked bar charts for top countries by latest-year loss rate
Income-level comparison charts
Regional maps (darker shade = higher loss and consumption)
Long-term trend lines for electricity performance
Business Questions
How does electricity consumption vary across income levels and regions?
Which countries record the highest electricity loss rates in the latest year?
How do system losses differ by income group and region?
How large is the gap between MENA and Sub-Saharan Africa?
What long-term trends indicate improvement or stagnation?
Key Insights & Findings
Consumption Inequality: Per-capita electricity consumption is concentrated in high- and upper-middle-income countries, while low-income countries consume significantly less.
Loss Rate Concentration: High electricity loss rates are concentrated in a limited number of countries, highlighting infrastructure and efficiency challenges rather than demand alone.
Regional Disparities: MENA consistently outperforms Sub-Saharan Africa in both consumption levels and grid efficiency.
Misleading Averages: Regional averages are skewed by a few high-performing countries; country-level analysis provides a clearer picture of energy access gaps.
Trend Patterns: Electricity outcomes show long-term improvement, but growth remains uneven and volatile in lower-income economies.
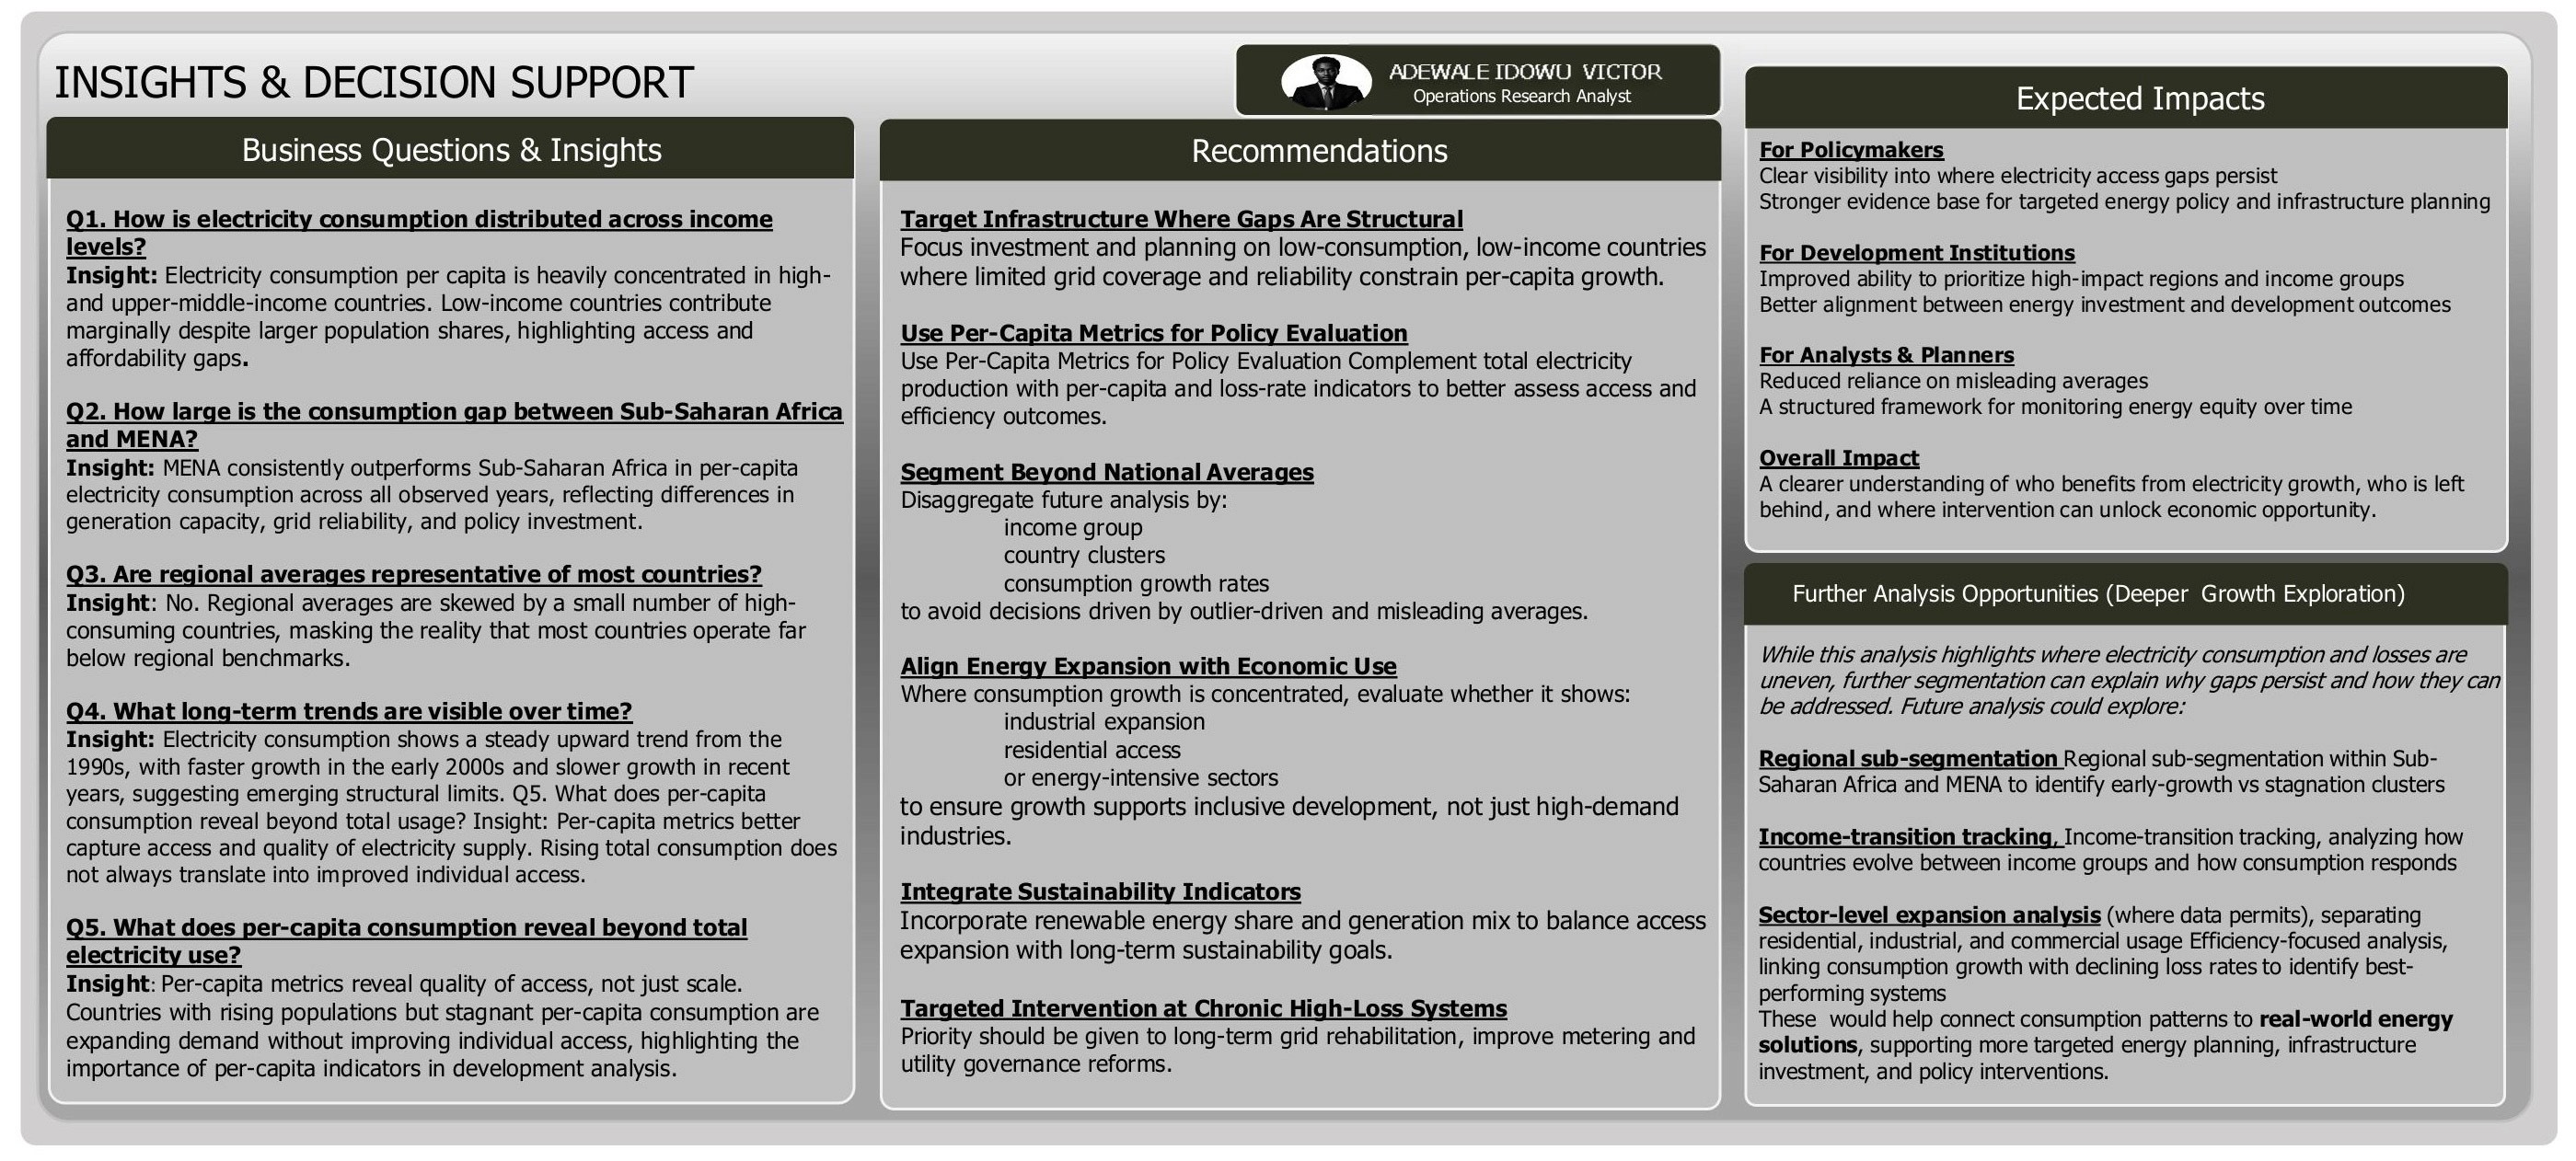
Recommendations
Prioritize grid efficiency improvements in high-loss countries
Track per-capita consumption alongside loss rates for balanced evaluation
Segment energy planning by income level and region
Use trend analysis to identify stagnation and recovery periods
Expected Impact
Clear visibility into electricity access and efficiency gaps
Stronger evidence base for infrastructure investment decisions
Improved support for energy and development policy discussions
Electricity Consumption & Loss Analysis
Electricity Consumption & Loss Analysis
Electricity Consumption & Loss Analysis
Assessing regional, income-based, and efficiency disparities
Assessing regional, income-based, and efficiency disparities
Role
Data Analyst
Industry
Energy | Economic Development
Duration
2 weeks

Project Overview
This project analyzes electricity consumption and system losses across African and MENA countries, focusing on per-capita usage, income-level disparities, electricity loss rates, and long-term trends.
Using World Bank data in Excel, raw multi-year energy records were transformed into a structured analytical model that reveals where electricity access is constrained, where inefficiencies persist, and how income and region influence energy outcomes.
Process & Methodology
Data Cleaning & Transformation (Excel Power Query)
Unpivoted year-based columns into a time-series format
Removed blank and inconsistent records
Standardized country names and classifications
Enriched missing income-level data to ensure accurate segmentation
Data Modeling & KPI Development (Power Pivot / DAX)
Built a structured data model using Country, Region, Income Level, and Date tables
Resolved filter inconsistencies by aligning fact and dimension tables
Developed KPIs for:
Electricity consumption per capita
Electricity loss rate (% of output)
Income-level and regional averages
Year-over-year and long-term trends
Visualization & Insight Design (Excel Dashboards)
KPI cards for consumption and loss metrics
Ranked bar charts for top countries by latest-year loss rate
Income-level comparison charts
Regional maps (darker shade = higher loss and consumption)
Long-term trend lines for electricity performance
Business Questions
How does electricity consumption vary across income levels and regions?
Which countries record the highest electricity loss rates in the latest year?
How do system losses differ by income group and region?
How large is the gap between MENA and Sub-Saharan Africa?
What long-term trends indicate improvement or stagnation?
Key Insights & Findings
Consumption Inequality: Per-capita electricity consumption is concentrated in high- and upper-middle-income countries, while low-income countries consume significantly less.
Loss Rate Concentration: High electricity loss rates are concentrated in a limited number of countries, highlighting infrastructure and efficiency challenges rather than demand alone.
Regional Disparities: MENA consistently outperforms Sub-Saharan Africa in both consumption levels and grid efficiency.
Misleading Averages: Regional averages are skewed by a few high-performing countries; country-level analysis provides a clearer picture of energy access gaps.
Trend Patterns: Electricity outcomes show long-term improvement, but growth remains uneven and volatile in lower-income economies.
Recommendations
Prioritize grid efficiency improvements in high-loss countries
Track per-capita consumption alongside loss rates for balanced evaluation
Segment energy planning by income level and region
Use trend analysis to identify stagnation and recovery periods
Expected Impact
Clear visibility into electricity access and efficiency gaps
Stronger evidence base for infrastructure investment decisions
Improved support for energy and development policy discussions
View Document

Facility Operations Service Request & Maintenance Performance Dashboard
Facility Operations Service Request & Maintenance Performance Dashboard
Operational analytics system for tracking resident complaints, monitoring maintenance performance, and identifying recurring infrastructure issues across residential blocks.
Operational analytics system for tracking resident complaints, monitoring maintenance performance, and identifying recurring infrastructure issues across residential blocks.
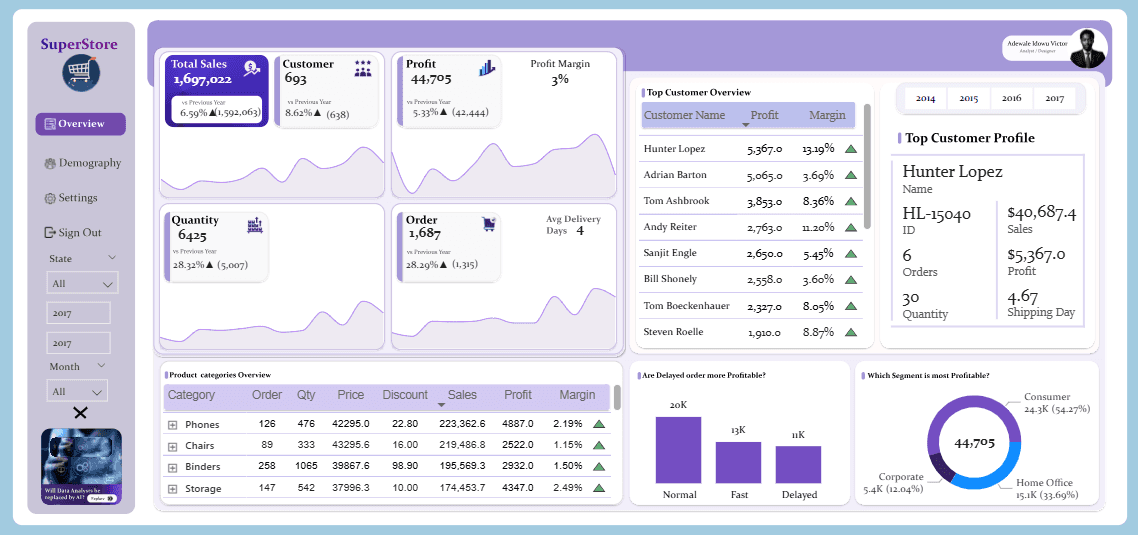
Superstore Operational Efficiency & Sales Performance Analysis
Superstore Operational Efficiency & Sales Performance Analysis
A data-driven review of profitability and supply chain efficiency.
A data-driven review of profitability and supply chain efficiency.

Facility Operations & Maintenance Performance Analysis
Facility Operations & Maintenance Performance Analysis
A data-driven review of maintenance demand, service efficiency, and infrastructure performance.
A data-driven review of maintenance demand, service efficiency, and infrastructure performance.

Metro Bank Analytics
Metro Bank Analytics
A Customer Experience and Risk Audit
A Customer Experience and Risk Audit
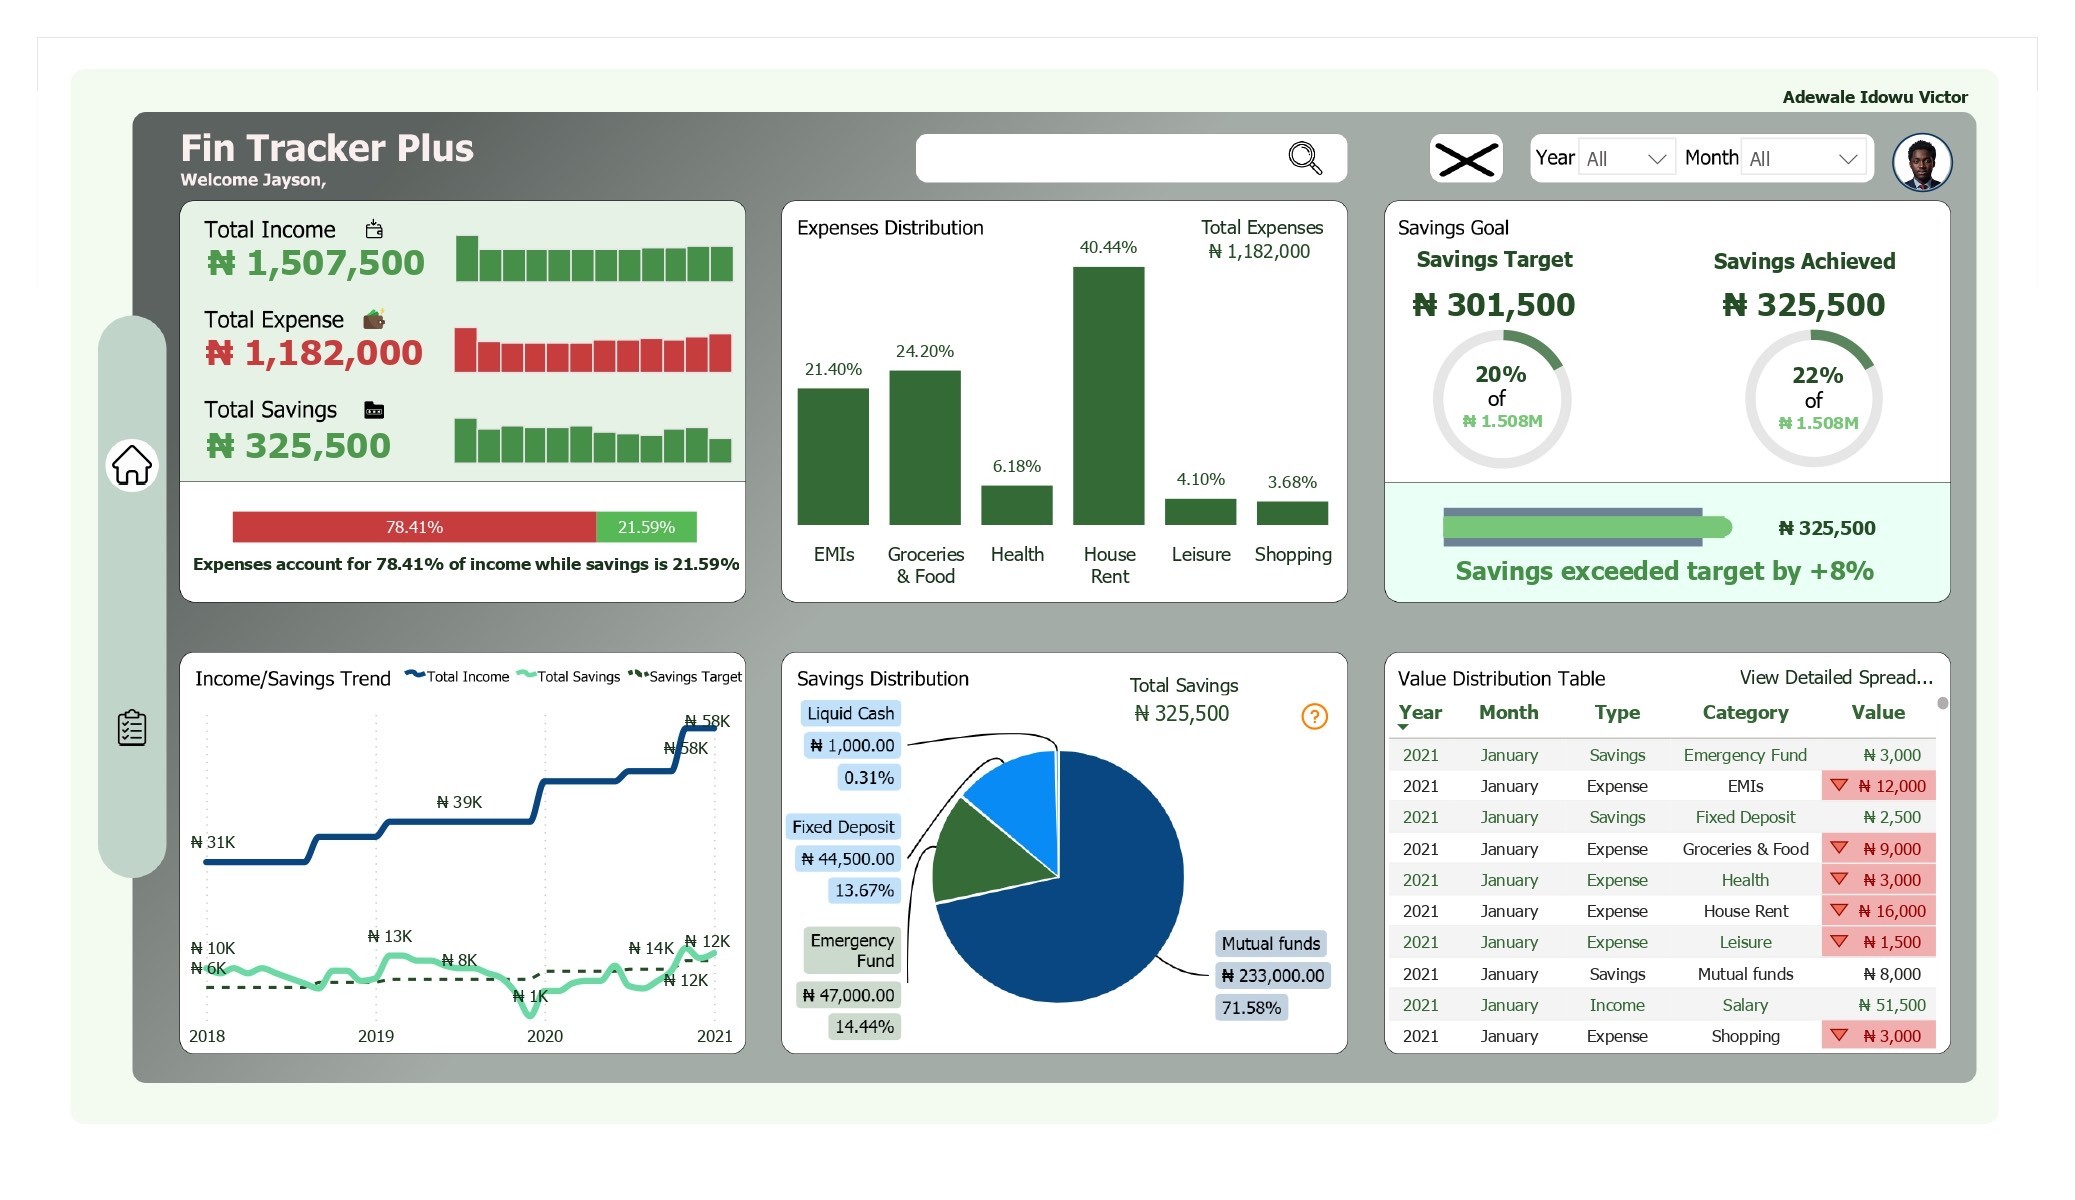
Personal Finance Tracker
Personal Finance Tracker
Summary of Incomes, Savings and Expenses Insight
Summary of Incomes, Savings and Expenses Insight

J&SONS FARM Sales Analysis
J&SONS FARM Sales Analysis
Implementing data-driven improvements
Implementing data-driven improvements

Digital Marketing Campaign Analysis
Digital Marketing Campaign Analysis
Analyzing February 2025 Campaigns to Maximize Profitability and Conversion
Analyzing February 2025 Campaigns to Maximize Profitability and Conversion

U.S. Population Dashboard (1950–2015)
U.S. Population Dashboard (1950–2015)
Demographic Trends for Healthcare Planning
Demographic Trends for Healthcare Planning

London Short-Let Market Analysis
London Short-Let Market Analysis
Uncovering Pricing, Host Behavior, and Market Opportunities Across 68K Property Listings
Uncovering Pricing, Host Behavior, and Market Opportunities Across 68K Property Listings

Telecom Customer Churn Analysis
Telecom Customer Churn Analysis
Identifying Churn Drivers and Revenue Risks to Improve Retention Strategy
Identifying Churn Drivers and Revenue Risks to Improve Retention Strategy

Product Sales Performance Dashboard
Product Sales Performance Dashboard
Identifying Revenue Drivers, Low-Margin Products, and Seasonal Trends Across SKUs
Identifying Revenue Drivers, Low-Margin Products, and Seasonal Trends Across SKUs

Customer Order Performance
Customer Order Performance
Optimizing Conversion, Segment Strategy, and Seasonal Sales Across Markets
Optimizing Conversion, Segment Strategy, and Seasonal Sales Across Markets