Role
Industry
Facility Management | Residential Real Estate
Duration
View Live Dashboard
Project Overview
This analysis provides a structured operational view of maintenance activities across residential blocks, focusing on complaint volume, service response, and infrastructure reliability.
The dashboard highlights the relationship between maintenance demand and service performance, revealing how recurring issues and workload distribution impact operational efficiency.
With a total of 87 complaints recorded, the system tracks resolution progress across Resolved (45), In-Progress (20), and Pending (22) cases, providing a real-time snapshot of facility performance.
Process, Steps, and Methodology
The system was developed using a structured operational analytics workflow:
Data Structuring & Integration (Google Sheets → Power BI)
Raw complaint records were cleaned, standardized, and structured in Google Sheets, then connected to Power BI through a live data pipeline with scheduled refresh for continuous updates.
Operational KPI Development
Key metrics were defined to monitor service performance, including:
Total complaints
Resolution status (Resolved, Pending, In-Progress)
Complaint distribution by category and block
Visualization & Dashboard Design
Interactive visuals were built to:
Track complaint trends by category
Monitor service resolution progress
Identify high-demand residential blocks
Provide real-time operational visibility
Business Questions
Which maintenance categories generate the highest complaint volume?
Which residential blocks experience the highest service demand?
What proportion of complaints are resolved versus pending?
Where are service delays or operational bottlenecks occurring?
Which issues indicate recurring infrastructure weaknesses?
Key Insights and Findings
1. Maintenance Demand Concentration
Plumbing issues represent the highest volume of complaints (30 cases), followed by carpentry (18) and electrical (16), indicating recurring infrastructure pressure points within core building systems.
2. Uneven Service Demand Across Blocks
Complaint distribution shows that certain blocks (e.g., Four and Six with 16 cases each) generate significantly higher service demand compared to others, suggesting localized infrastructure strain or usage intensity.
3. Service Performance & Workload Pressure
Out of 87 total complaints:
45 have been resolved
20 are in progress
22 remain pending
This indicates a moderate resolution rate but sustained operational backlog, reflecting ongoing maintenance workload and possible resource constraints.
4. Operational Visibility & Process Improvement
The transition from unstructured complaint records to a centralized dashboard significantly improves:
Monitoring of service progress
Identification of recurring issues
Decision-making speed for maintenance prioritization
5. Category-Based Infrastructure Risk
Lower-frequency categories such as ventilation and water supply still indicate critical but less frequent failures, which may require preventive monitoring despite lower volume.
Recommendations
Preventive Maintenance Strategy
High-frequency categories (especially plumbing) require scheduled inspections and proactive maintenance to reduce recurring complaints.Block-Level Intervention
Residential blocks with higher complaint volumes should be prioritized for infrastructure assessment and targeted maintenance actions.Service Efficiency Tracking
Introduce resolution time tracking (SLA-based KPIs) to reduce pending backlog and improve service delivery speed.Resource Allocation Optimization
Align maintenance teams and resources with demand-heavy categories and high-pressure blocks.
Expected Impact
Improved maintenance response efficiency
Reduced recurrence of infrastructure-related complaints
Better allocation of maintenance resources
Enhanced operational visibility and reporting
Increased resident satisfaction through faster issue resolution
Facility Operations & Maintenance Performance Analysis
Facility Operations & Maintenance Performance Analysis
Facility Operations & Maintenance Performance Analysis
A data-driven review of maintenance demand, service efficiency, and infrastructure performance.
A data-driven review of maintenance demand, service efficiency, and infrastructure performance.
Role
Industry
Facility Management | Residential Real Estate
Duration

Project Overview
This analysis provides a structured operational view of maintenance activities across residential blocks, focusing on complaint volume, service response, and infrastructure reliability.
The dashboard highlights the relationship between maintenance demand and service performance, revealing how recurring issues and workload distribution impact operational efficiency.
With a total of 87 complaints recorded, the system tracks resolution progress across Resolved (45), In-Progress (20), and Pending (22) cases, providing a real-time snapshot of facility performance.
Process, Steps, and Methodology
The system was developed using a structured operational analytics workflow:
Data Structuring & Integration (Google Sheets → Power BI)
Raw complaint records were cleaned, standardized, and structured in Google Sheets, then connected to Power BI through a live data pipeline with scheduled refresh for continuous updates.
Operational KPI Development
Key metrics were defined to monitor service performance, including:
Total complaints
Resolution status (Resolved, Pending, In-Progress)
Complaint distribution by category and block
Visualization & Dashboard Design
Interactive visuals were built to:
Track complaint trends by category
Monitor service resolution progress
Identify high-demand residential blocks
Provide real-time operational visibility
Business Questions
Which maintenance categories generate the highest complaint volume?
Which residential blocks experience the highest service demand?
What proportion of complaints are resolved versus pending?
Where are service delays or operational bottlenecks occurring?
Which issues indicate recurring infrastructure weaknesses?
Key Insights and Findings
1. Maintenance Demand Concentration
Plumbing issues represent the highest volume of complaints (30 cases), followed by carpentry (18) and electrical (16), indicating recurring infrastructure pressure points within core building systems.
2. Uneven Service Demand Across Blocks
Complaint distribution shows that certain blocks (e.g., Four and Six with 16 cases each) generate significantly higher service demand compared to others, suggesting localized infrastructure strain or usage intensity.
3. Service Performance & Workload Pressure
Out of 87 total complaints:
45 have been resolved
20 are in progress
22 remain pending
This indicates a moderate resolution rate but sustained operational backlog, reflecting ongoing maintenance workload and possible resource constraints.
4. Operational Visibility & Process Improvement
The transition from unstructured complaint records to a centralized dashboard significantly improves:
Monitoring of service progress
Identification of recurring issues
Decision-making speed for maintenance prioritization
5. Category-Based Infrastructure Risk
Lower-frequency categories such as ventilation and water supply still indicate critical but less frequent failures, which may require preventive monitoring despite lower volume.
Recommendations
Preventive Maintenance Strategy
High-frequency categories (especially plumbing) require scheduled inspections and proactive maintenance to reduce recurring complaints.Block-Level Intervention
Residential blocks with higher complaint volumes should be prioritized for infrastructure assessment and targeted maintenance actions.Service Efficiency Tracking
Introduce resolution time tracking (SLA-based KPIs) to reduce pending backlog and improve service delivery speed.Resource Allocation Optimization
Align maintenance teams and resources with demand-heavy categories and high-pressure blocks.
Expected Impact
Improved maintenance response efficiency
Reduced recurrence of infrastructure-related complaints
Better allocation of maintenance resources
Enhanced operational visibility and reporting
Increased resident satisfaction through faster issue resolution
View Document

Electricity Consumption & Loss Analysis
Electricity Consumption & Loss Analysis
Assessing regional, income-based, and efficiency disparities
Assessing regional, income-based, and efficiency disparities

Facility Operations Service Request & Maintenance Performance Dashboard
Facility Operations Service Request & Maintenance Performance Dashboard
Operational analytics system for tracking resident complaints, monitoring maintenance performance, and identifying recurring infrastructure issues across residential blocks.
Operational analytics system for tracking resident complaints, monitoring maintenance performance, and identifying recurring infrastructure issues across residential blocks.
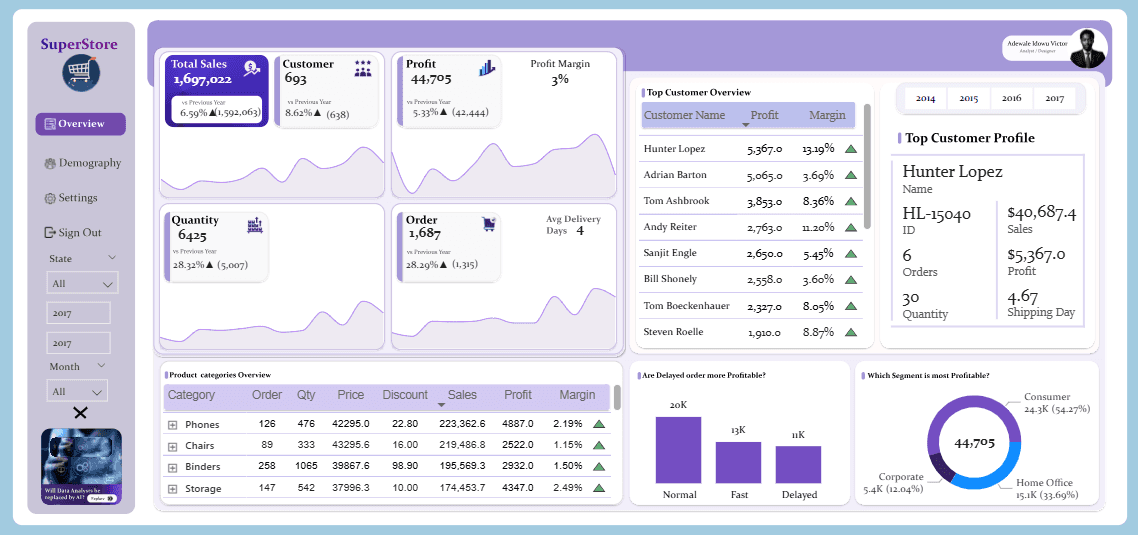
Superstore Operational Efficiency & Sales Performance Analysis
Superstore Operational Efficiency & Sales Performance Analysis
A data-driven review of profitability and supply chain efficiency.
A data-driven review of profitability and supply chain efficiency.

Metro Bank Analytics
Metro Bank Analytics
A Customer Experience and Risk Audit
A Customer Experience and Risk Audit
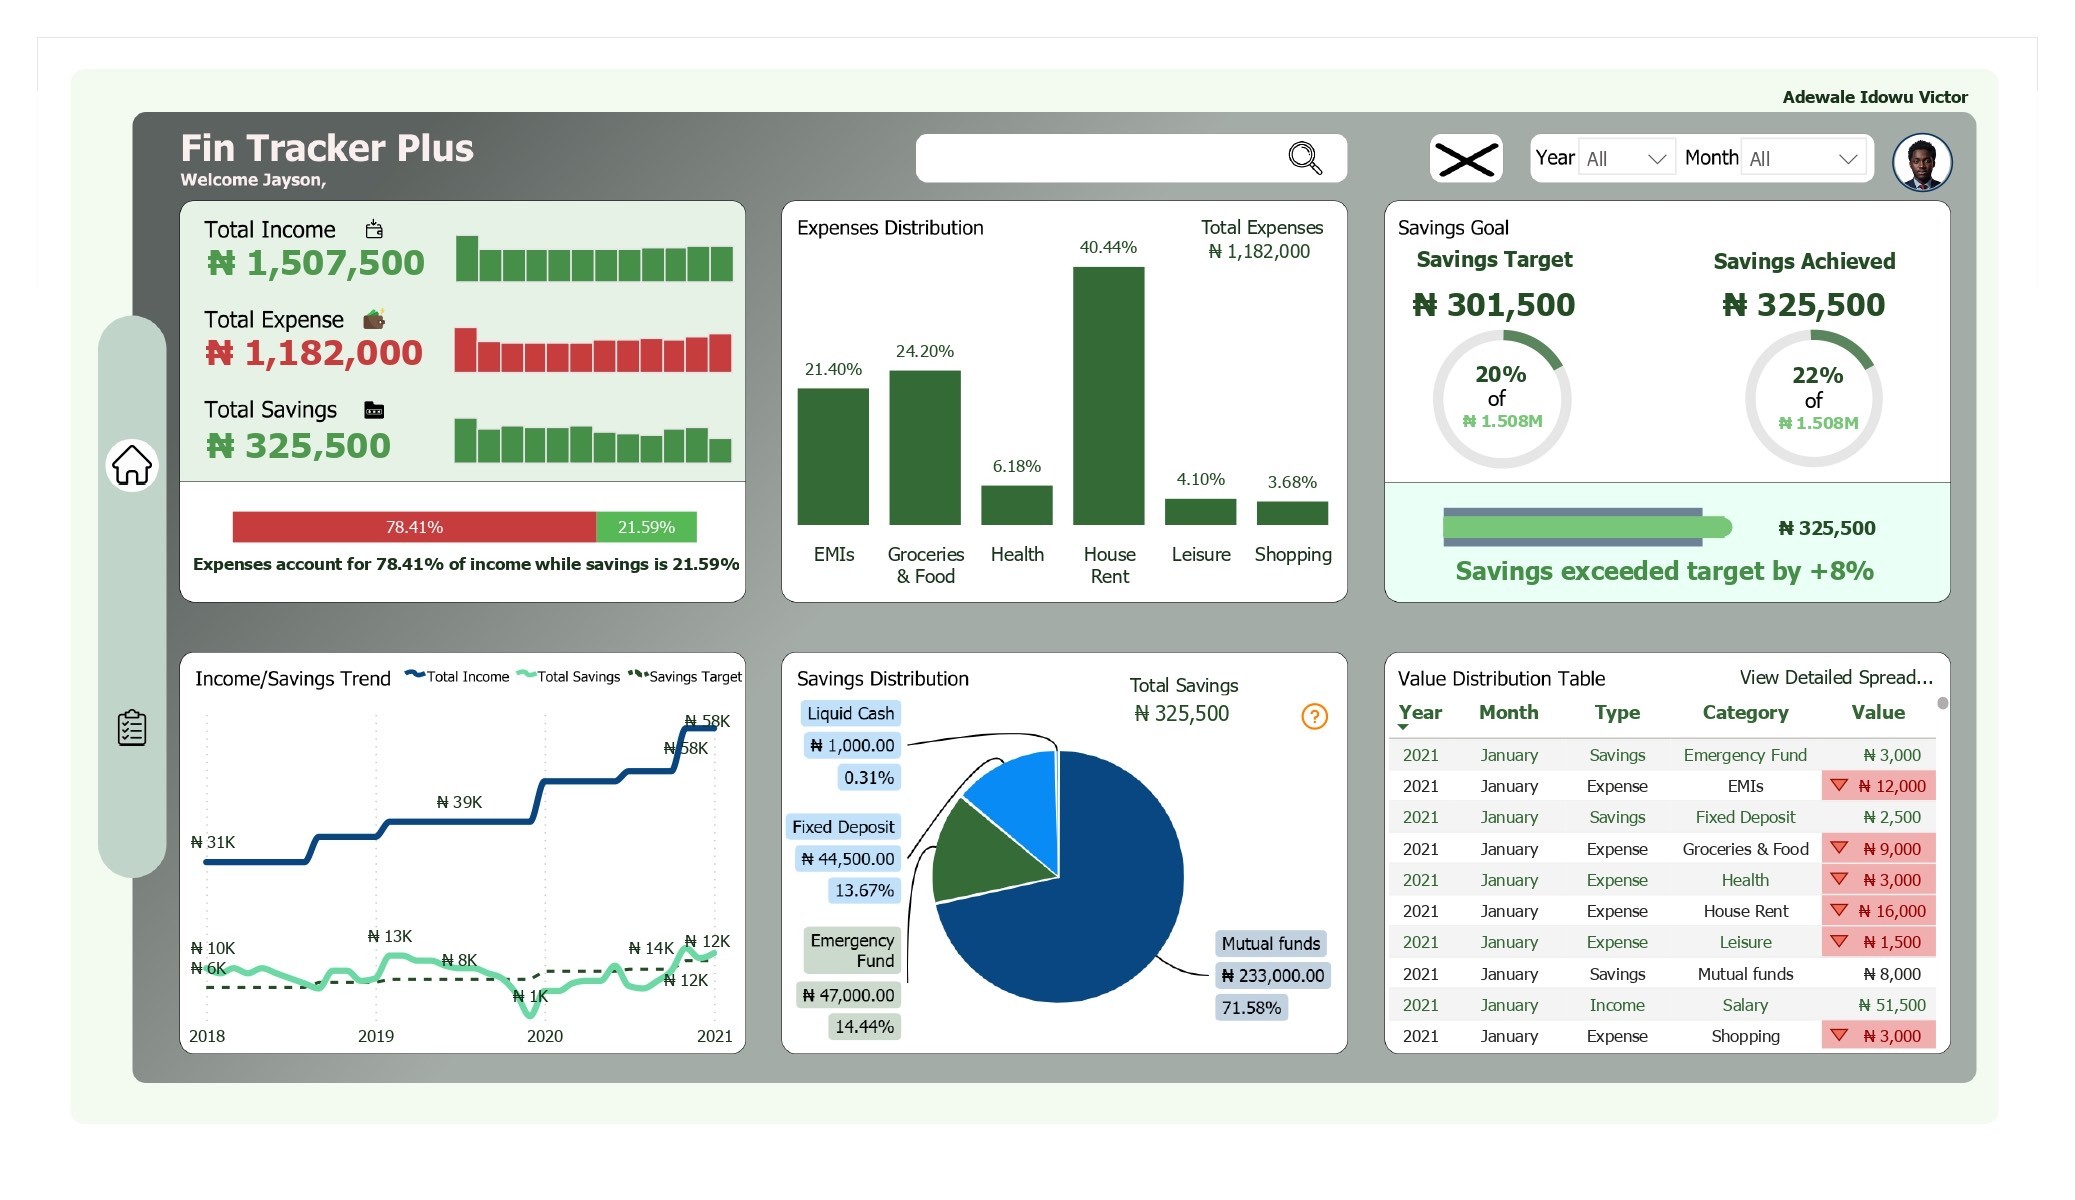
Personal Finance Tracker
Personal Finance Tracker
Summary of Incomes, Savings and Expenses Insight
Summary of Incomes, Savings and Expenses Insight

J&SONS FARM Sales Analysis
J&SONS FARM Sales Analysis
Implementing data-driven improvements
Implementing data-driven improvements

Digital Marketing Campaign Analysis
Digital Marketing Campaign Analysis
Analyzing February 2025 Campaigns to Maximize Profitability and Conversion
Analyzing February 2025 Campaigns to Maximize Profitability and Conversion

U.S. Population Dashboard (1950–2015)
U.S. Population Dashboard (1950–2015)
Demographic Trends for Healthcare Planning
Demographic Trends for Healthcare Planning

London Short-Let Market Analysis
London Short-Let Market Analysis
Uncovering Pricing, Host Behavior, and Market Opportunities Across 68K Property Listings
Uncovering Pricing, Host Behavior, and Market Opportunities Across 68K Property Listings

Telecom Customer Churn Analysis
Telecom Customer Churn Analysis
Identifying Churn Drivers and Revenue Risks to Improve Retention Strategy
Identifying Churn Drivers and Revenue Risks to Improve Retention Strategy

Product Sales Performance Dashboard
Product Sales Performance Dashboard
Identifying Revenue Drivers, Low-Margin Products, and Seasonal Trends Across SKUs
Identifying Revenue Drivers, Low-Margin Products, and Seasonal Trends Across SKUs

Customer Order Performance
Customer Order Performance
Optimizing Conversion, Segment Strategy, and Seasonal Sales Across Markets
Optimizing Conversion, Segment Strategy, and Seasonal Sales Across Markets