Role
Data & Operations Analyst
Industry
Facility Management / Residential Property Operations / Real Estate
Duration
View Live Dashboard
Project Overview
This project analyzes resident service requests and maintenance operations within a residential facility, focusing on complaint categories, resolution performance, and service demand across building blocks.
Using Google Sheets, operational complaint records from multiple residential blocks were transformed into a structured tracking and monitoring system that enables facility management to monitor maintenance requests, track service progress, and identify recurring operational issues.
The system consolidates complaints reported by residents and categorizes them by maintenance type, service status, and building block, enabling facility managers to quickly identify operational bottlenecks and areas requiring attention.
By structuring raw operational records into a dashboard-driven monitoring system, the project provides clearer visibility into maintenance demand, response progress, and infrastructure-related service trends.
Project Objective
The objective of this project was to develop a centralized complaint monitoring and service performance system that allows facility managers to:
Track resident complaints across multiple residential blocks
Monitor complaint resolution progress
Identify recurring infrastructure and maintenance issues
Improve maintenance prioritization and service response monitoring
Process & Methodology
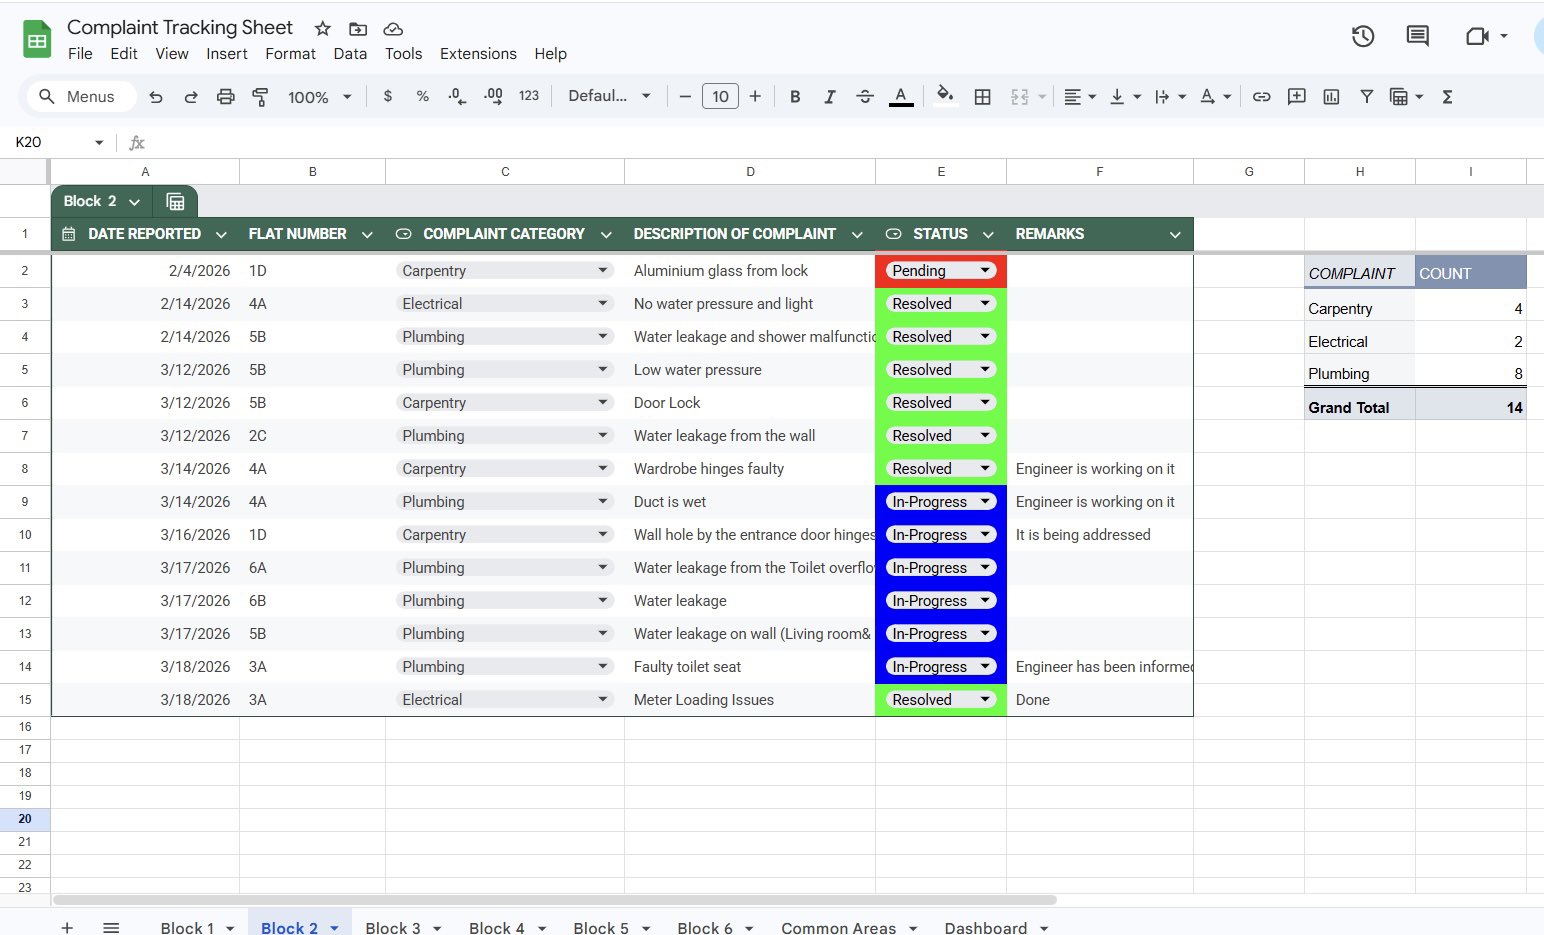
Data Structuring & Standardization (Google Sheets)
Complaint records from multiple residential blocks were consolidated into a standardized data structure containing:
Date reported
Flat / apartment number
Complaint category
Complaint description
Resolution status
Maintenance remarks
To ensure consistent data entry and reliable reporting:
Complaint categories were standardized (Carpentry, Electrical, Plumbing, Ventilation, Cleaning, Others).
Data validation dropdown fields were implemented for complaint status tracking (Pending, In-Progress, Resolved).
Maintenance remarks fields were included to document service updates and engineer actions.
This structured dataset created a reliable foundation for operational monitoring and dashboard reporting.
Operational Data Modeling & KPI Development
A structured monitoring model was developed to aggregate complaint data across building blocks and generate key operational performance indicators.
Key operational KPIs include:
Total Complaints Reported
Resolved Complaints
Pending Complaints
In-Progress Complaints
Additional analytical breakdowns include:
Complaints by maintenance category
Complaints by building block
Complaint status distribution
These metrics provide a clear overview of maintenance workload, service progress, and operational demand within the facility.
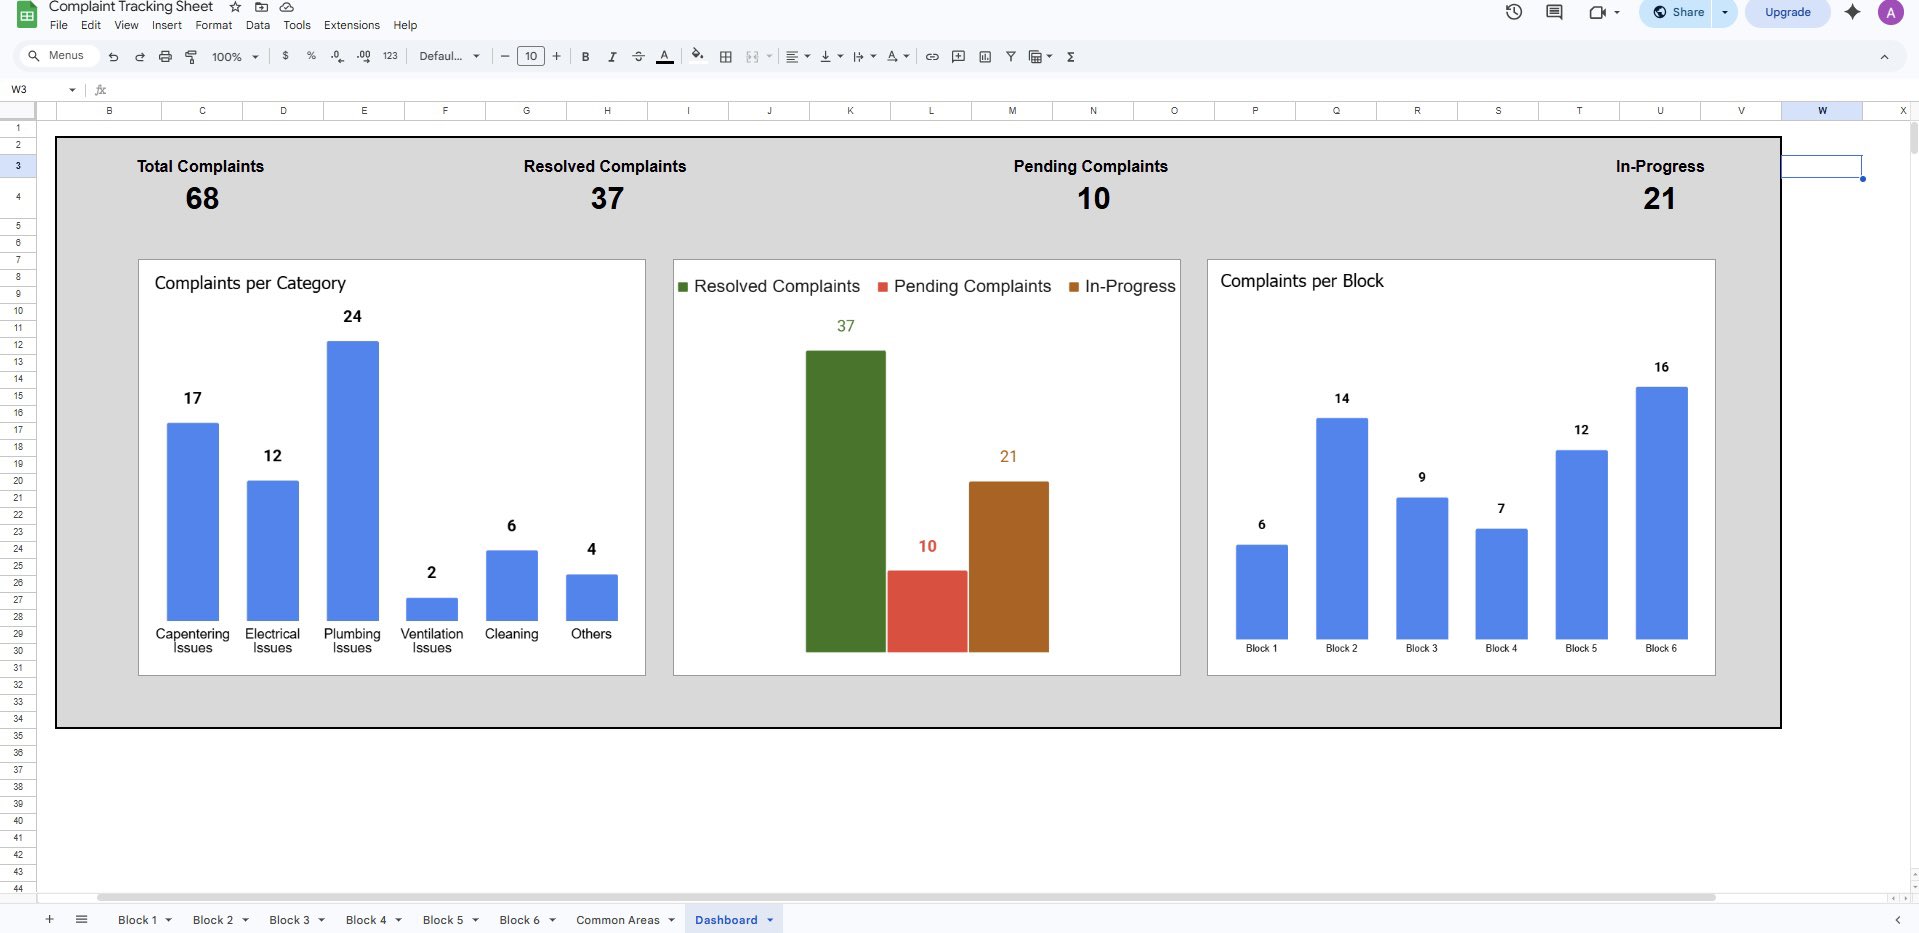
Dashboard & Visualization Design (Google Sheets)
A visual dashboard was developed to provide quick operational insights for facility managers.
Dashboard components include:
KPI Summary Cards
Total complaints reported
Complaints resolved
Complaints pending
Complaints currently in progress
Complaint Category Analysis: Identifies the most frequent maintenance issues reported by residents.
Complaint Status Distribution: Provides visibility into service resolution progress.
Block-Level Complaint Analysis: Highlights which residential blocks generate the highest service demand.
The dashboard allows facility managers to quickly identify maintenance trends, workload pressure points, and operational inefficiencies.
Business Questions
The analysis was designed to answer key operational questions:
Which maintenance categories generate the most resident complaints?
Which building blocks experience the highest maintenance demand?
What proportion of complaints have been resolved versus still pending?
Where are operational bottlenecks occurring in the service process?
Which infrastructure issues require preventive maintenance attention?
Key Insights & Findings
Recurring Infrastructure Issues: Plumbing-related complaints account for the largest share of service requests, indicating potential infrastructure weaknesses or recurring maintenance needs.
Service Demand Distribution: Certain residential blocks record higher complaint volumes, suggesting uneven infrastructure conditions or higher operational stress in specific areas.
Active Maintenance Workload: While many complaints have been resolved, a noticeable share remain in progress, indicating ongoing operational workload and maintenance resource allocation.
Operational Visibility Improvement: Prior to structured tracking, complaint records were scattered across blocks, making it difficult to monitor maintenance demand or service performance. The dashboard provides centralized operational visibility.
Recommendations
Implement Preventive Maintenance Programs: Recurring complaints, particularly plumbing-related issues, suggest the need for preventive inspections and infrastructure maintenance.
Prioritize High-Demand Blocks: Blocks with higher complaint volumes should receive closer monitoring and targeted maintenance interventions.
Track Service Resolution Timelines: Monitoring complaint resolution time can help improve service efficiency and reduce operational backlog.
Standardize Complaint Logging Across the Facility: Consistent complaint tracking ensures better operational data for long-term performance monitoring.
Expected Impact
Improved visibility into facility maintenance operations
Faster identification of recurring infrastructure issues
Better prioritization of maintenance tasks
Improved monitoring of service response progress
Enhanced resident satisfaction through structured complaint resolution tracking
Tools
Google Sheets
Pivot Tables
Data Validation
Dashboard Design
Operational KPI Monitoring
Skills Demonstrated
Operational Data Structuring
Maintenance Demand Analysis
Service Performance Monitoring
Dashboard Development
Operational Reporting & Insights
Facility Operations Service Request & Maintenance Performance Dashboard
Facility Operations Service Request & Maintenance Performance Dashboard
Facility Operations Service Request & Maintenance Performance Dashboard
Operational analytics system for tracking resident complaints, monitoring maintenance performance, and identifying recurring infrastructure issues across residential blocks.
Operational analytics system for tracking resident complaints, monitoring maintenance performance, and identifying recurring infrastructure issues across residential blocks.
Role
Data & Operations Analyst
Industry
Facility Management / Residential Property Operations / Real Estate
Duration

Project Overview
This project analyzes resident service requests and maintenance operations within a residential facility, focusing on complaint categories, resolution performance, and service demand across building blocks.
Using Google Sheets, operational complaint records from multiple residential blocks were transformed into a structured tracking and monitoring system that enables facility management to monitor maintenance requests, track service progress, and identify recurring operational issues.
The system consolidates complaints reported by residents and categorizes them by maintenance type, service status, and building block, enabling facility managers to quickly identify operational bottlenecks and areas requiring attention.
By structuring raw operational records into a dashboard-driven monitoring system, the project provides clearer visibility into maintenance demand, response progress, and infrastructure-related service trends.
Project Objective
The objective of this project was to develop a centralized complaint monitoring and service performance system that allows facility managers to:
Track resident complaints across multiple residential blocks
Monitor complaint resolution progress
Identify recurring infrastructure and maintenance issues
Improve maintenance prioritization and service response monitoring
Process & Methodology
Data Structuring & Standardization (Google Sheets)
Complaint records from multiple residential blocks were consolidated into a standardized data structure containing:
Date reported
Flat / apartment number
Complaint category
Complaint description
Resolution status
Maintenance remarks
To ensure consistent data entry and reliable reporting:
Complaint categories were standardized (Carpentry, Electrical, Plumbing, Ventilation, Cleaning, Others).
Data validation dropdown fields were implemented for complaint status tracking (Pending, In-Progress, Resolved).
Maintenance remarks fields were included to document service updates and engineer actions.
This structured dataset created a reliable foundation for operational monitoring and dashboard reporting.
Operational Data Modeling & KPI Development
A structured monitoring model was developed to aggregate complaint data across building blocks and generate key operational performance indicators.
Key operational KPIs include:
Total Complaints Reported
Resolved Complaints
Pending Complaints
In-Progress Complaints
Additional analytical breakdowns include:
Complaints by maintenance category
Complaints by building block
Complaint status distribution
These metrics provide a clear overview of maintenance workload, service progress, and operational demand within the facility.
Dashboard & Visualization Design (Google Sheets)
A visual dashboard was developed to provide quick operational insights for facility managers.
Dashboard components include:
KPI Summary Cards
Total complaints reported
Complaints resolved
Complaints pending
Complaints currently in progress
Complaint Category Analysis: Identifies the most frequent maintenance issues reported by residents.
Complaint Status Distribution: Provides visibility into service resolution progress.
Block-Level Complaint Analysis: Highlights which residential blocks generate the highest service demand.
The dashboard allows facility managers to quickly identify maintenance trends, workload pressure points, and operational inefficiencies.
Business Questions
The analysis was designed to answer key operational questions:
Which maintenance categories generate the most resident complaints?
Which building blocks experience the highest maintenance demand?
What proportion of complaints have been resolved versus still pending?
Where are operational bottlenecks occurring in the service process?
Which infrastructure issues require preventive maintenance attention?
Key Insights & Findings
Recurring Infrastructure Issues: Plumbing-related complaints account for the largest share of service requests, indicating potential infrastructure weaknesses or recurring maintenance needs.
Service Demand Distribution: Certain residential blocks record higher complaint volumes, suggesting uneven infrastructure conditions or higher operational stress in specific areas.
Active Maintenance Workload: While many complaints have been resolved, a noticeable share remain in progress, indicating ongoing operational workload and maintenance resource allocation.
Operational Visibility Improvement: Prior to structured tracking, complaint records were scattered across blocks, making it difficult to monitor maintenance demand or service performance. The dashboard provides centralized operational visibility.
Recommendations
Implement Preventive Maintenance Programs: Recurring complaints, particularly plumbing-related issues, suggest the need for preventive inspections and infrastructure maintenance.
Prioritize High-Demand Blocks: Blocks with higher complaint volumes should receive closer monitoring and targeted maintenance interventions.
Track Service Resolution Timelines: Monitoring complaint resolution time can help improve service efficiency and reduce operational backlog.
Standardize Complaint Logging Across the Facility: Consistent complaint tracking ensures better operational data for long-term performance monitoring.
Expected Impact
Improved visibility into facility maintenance operations
Faster identification of recurring infrastructure issues
Better prioritization of maintenance tasks
Improved monitoring of service response progress
Enhanced resident satisfaction through structured complaint resolution tracking
Tools
Google Sheets
Pivot Tables
Data Validation
Dashboard Design
Operational KPI Monitoring
Skills Demonstrated
Operational Data Structuring
Maintenance Demand Analysis
Service Performance Monitoring
Dashboard Development
Operational Reporting & Insights
View Document

Electricity Consumption & Loss Analysis
Electricity Consumption & Loss Analysis
Assessing regional, income-based, and efficiency disparities
Assessing regional, income-based, and efficiency disparities
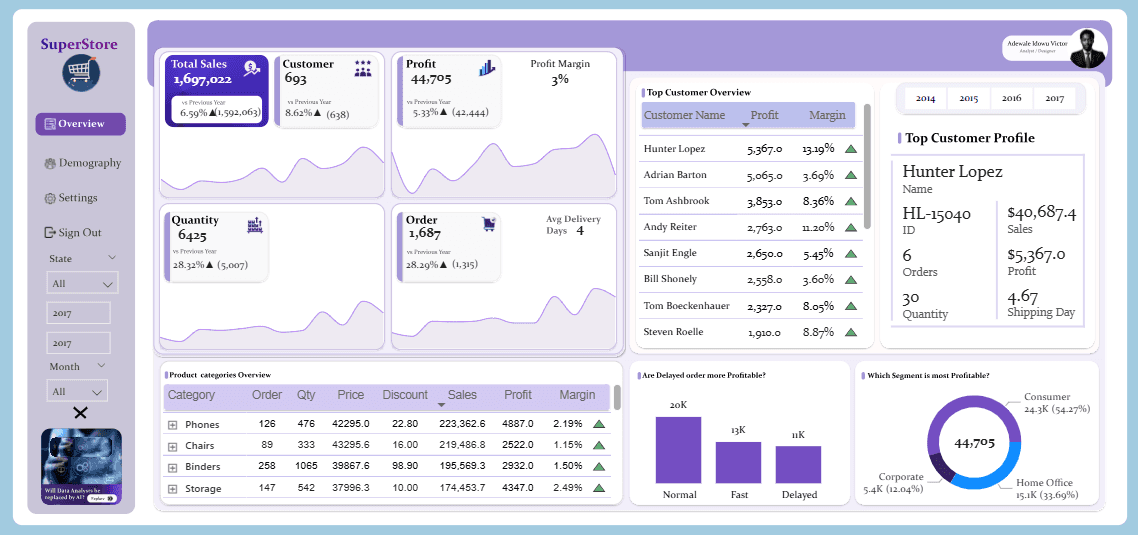
Superstore Operational Efficiency & Sales Performance Analysis
Superstore Operational Efficiency & Sales Performance Analysis
A data-driven review of profitability and supply chain efficiency.
A data-driven review of profitability and supply chain efficiency.

Facility Operations & Maintenance Performance Analysis
Facility Operations & Maintenance Performance Analysis
A data-driven review of maintenance demand, service efficiency, and infrastructure performance.
A data-driven review of maintenance demand, service efficiency, and infrastructure performance.

Metro Bank Analytics
Metro Bank Analytics
A Customer Experience and Risk Audit
A Customer Experience and Risk Audit
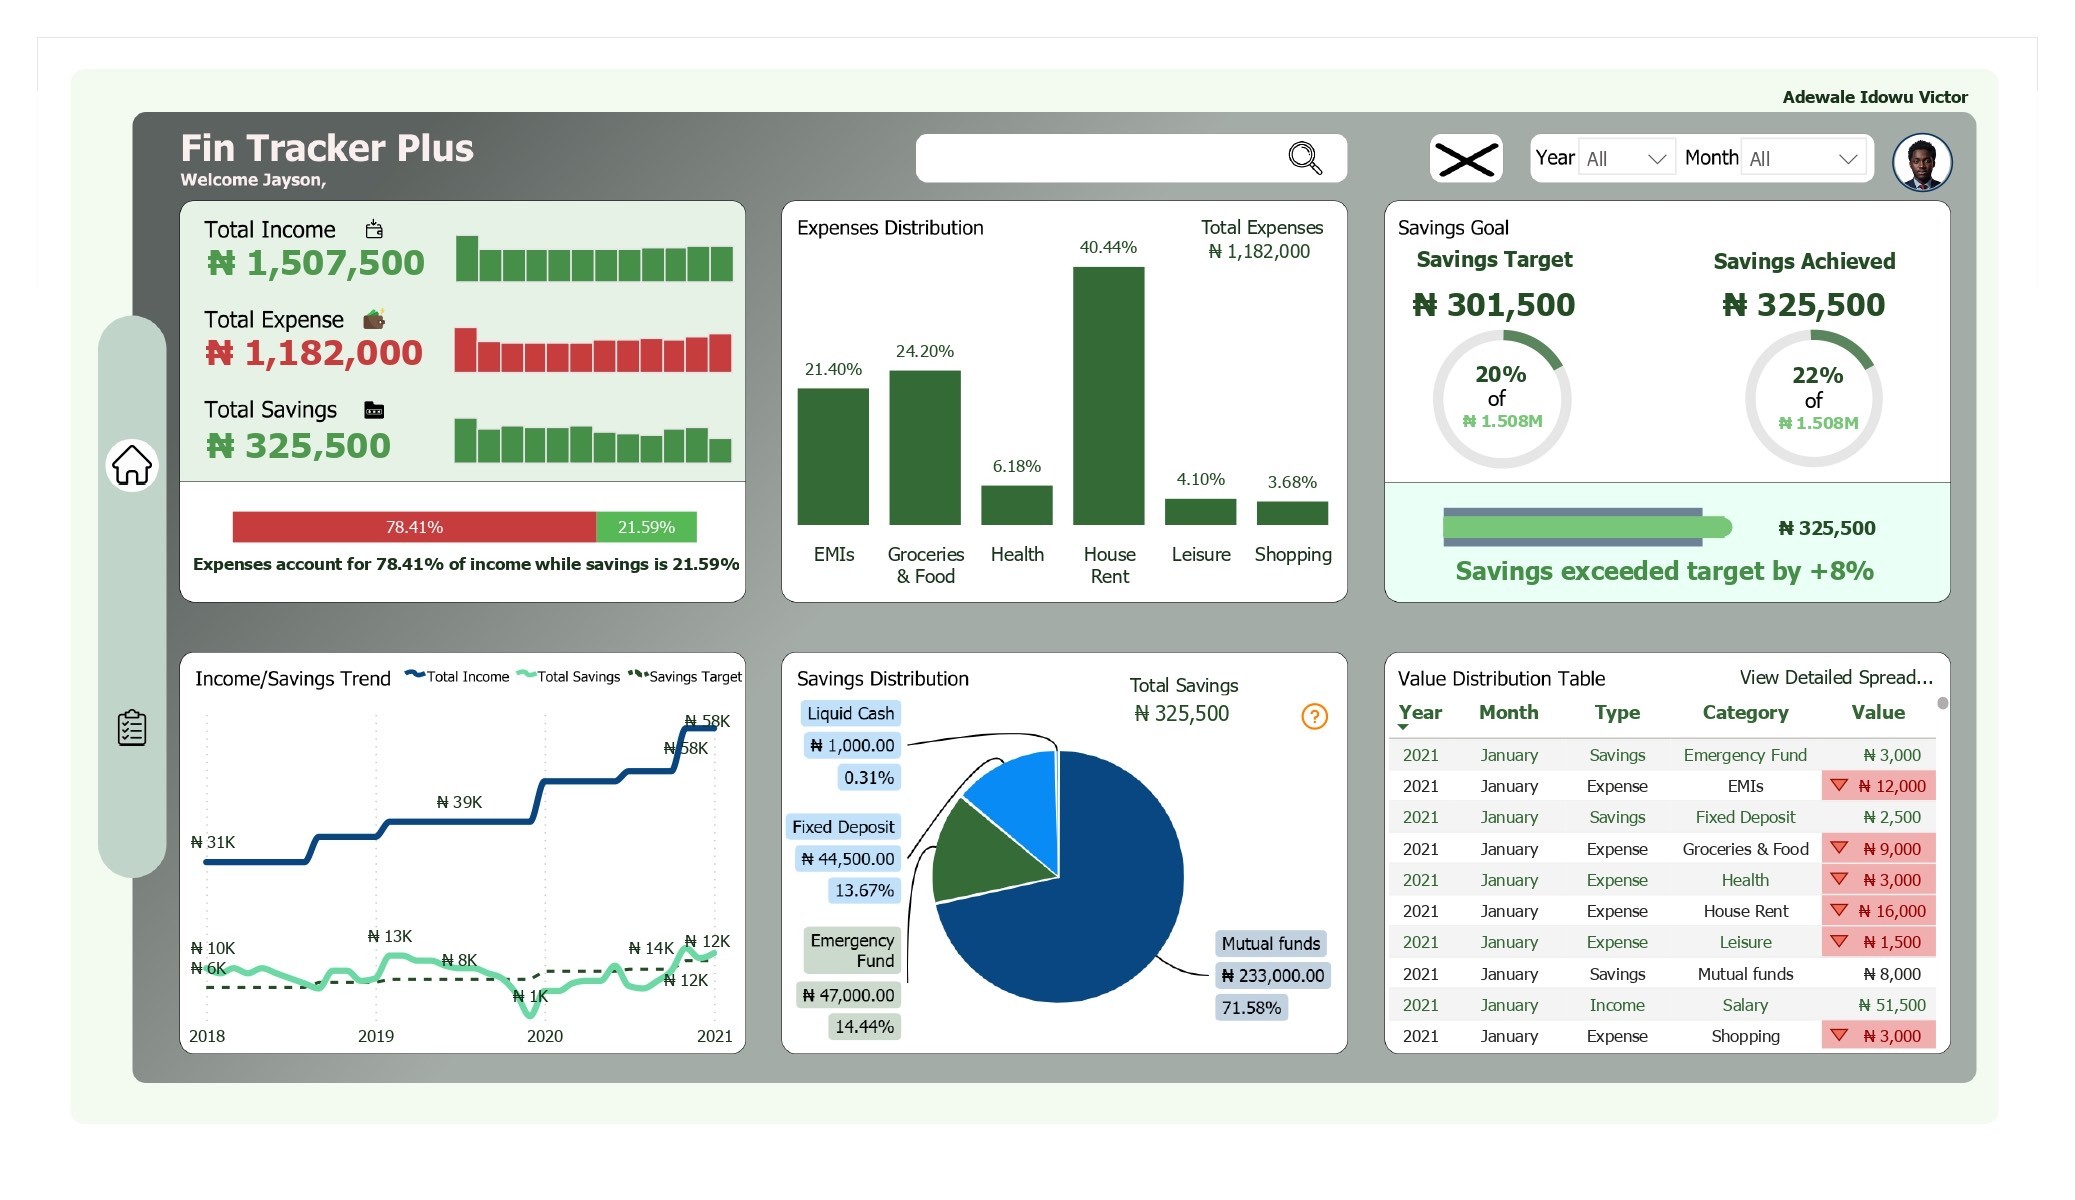
Personal Finance Tracker
Personal Finance Tracker
Summary of Incomes, Savings and Expenses Insight
Summary of Incomes, Savings and Expenses Insight

J&SONS FARM Sales Analysis
J&SONS FARM Sales Analysis
Implementing data-driven improvements
Implementing data-driven improvements

Digital Marketing Campaign Analysis
Digital Marketing Campaign Analysis
Analyzing February 2025 Campaigns to Maximize Profitability and Conversion
Analyzing February 2025 Campaigns to Maximize Profitability and Conversion

U.S. Population Dashboard (1950–2015)
U.S. Population Dashboard (1950–2015)
Demographic Trends for Healthcare Planning
Demographic Trends for Healthcare Planning

London Short-Let Market Analysis
London Short-Let Market Analysis
Uncovering Pricing, Host Behavior, and Market Opportunities Across 68K Property Listings
Uncovering Pricing, Host Behavior, and Market Opportunities Across 68K Property Listings

Telecom Customer Churn Analysis
Telecom Customer Churn Analysis
Identifying Churn Drivers and Revenue Risks to Improve Retention Strategy
Identifying Churn Drivers and Revenue Risks to Improve Retention Strategy

Product Sales Performance Dashboard
Product Sales Performance Dashboard
Identifying Revenue Drivers, Low-Margin Products, and Seasonal Trends Across SKUs
Identifying Revenue Drivers, Low-Margin Products, and Seasonal Trends Across SKUs

Customer Order Performance
Customer Order Performance
Optimizing Conversion, Segment Strategy, and Seasonal Sales Across Markets
Optimizing Conversion, Segment Strategy, and Seasonal Sales Across Markets